Toa Payoh by the numbers: why it leads S$1 million HDB resales
Toa Payoh had 15.9% of S$1 million HDB resales in the 12 months to September 2026. Which flats they are, resale and rent medians, and District 12 condos.
Toa Payoh recorded 293 of the island’s 1,847 HDB resales at S$1 million or more in the 12 months to September 2026 (Propwise count from HDB’s resale data). That is 15.9%, the largest share of any town, from a town with 4.1% of all resales.
More than half of those 293 flats had a lease start of 2020 or later, so they are not the town’s old blocks. The data shows where the deals are.
Toa Payoh and the S$1 million line
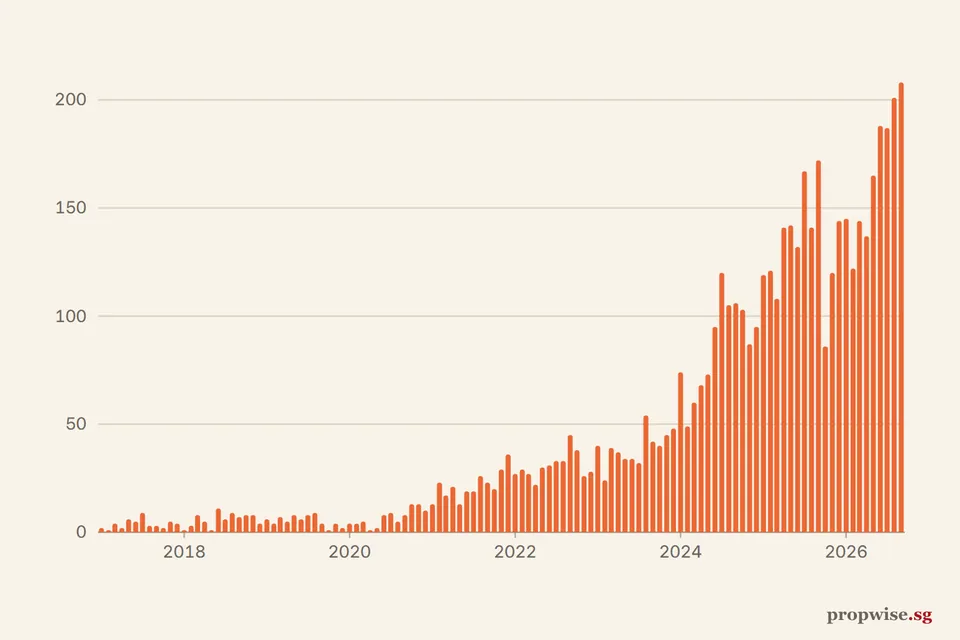
Islandwide, HDB registered 208 resales at S$1 million or more in Sep 2026, up 20.9% on a year earlier. As at September 2026 it is the highest month in a series that starts in January 2017.
Latest: S$1m+ 208 (Sep 2026), up 20.9% on Sep 2025.
Counts are by registration month. A month appears once it is complete.
Table view
| Period | Resales at S$1 million or more |
|---|---|
| Sep 2026 | 208 |
| Aug 2026 | 201 |
| Jul 2026 | 187 |
| Jun 2026 | 188 |
| May 2026 | 165 |
| Apr 2026 | 137 |
| Mar 2026 | 144 |
| Feb 2026 | 122 |
| Jan 2026 | 145 |
| Dec 2025 | 144 |
| Nov 2025 | 120 |
| Oct 2025 | 86 |
| Sep 2025 | 172 |
| Aug 2025 | 141 |
| Jul 2025 | 167 |
| Jun 2025 | 132 |
| May 2025 | 142 |
| Apr 2025 | 141 |
| Mar 2025 | 108 |
| Feb 2025 | 121 |
| Jan 2025 | 119 |
| Dec 2024 | 95 |
| Nov 2024 | 87 |
| Oct 2024 | 103 |
| Sep 2024 | 106 |
| Aug 2024 | 105 |
| Jul 2024 | 120 |
| Jun 2024 | 95 |
| May 2024 | 73 |
| Apr 2024 | 68 |
| Mar 2024 | 60 |
| Feb 2024 | 49 |
| Jan 2024 | 74 |
| Dec 2023 | 48 |
| Nov 2023 | 45 |
| Oct 2023 | 40 |
| Sep 2023 | 42 |
| Aug 2023 | 54 |
| Jul 2023 | 32 |
| Jun 2023 | 34 |
| May 2023 | 34 |
| Apr 2023 | 37 |
| Mar 2023 | 39 |
| Feb 2023 | 24 |
| Jan 2023 | 40 |
| Dec 2022 | 28 |
| Nov 2022 | 26 |
| Oct 2022 | 38 |
| Sep 2022 | 45 |
| Aug 2022 | 33 |
| Jul 2022 | 33 |
| Jun 2022 | 31 |
| May 2022 | 30 |
| Apr 2022 | 22 |
| Mar 2022 | 27 |
| Feb 2022 | 29 |
| Jan 2022 | 27 |
| Dec 2021 | 36 |
| Nov 2021 | 29 |
| Oct 2021 | 20 |
| Sep 2021 | 23 |
| Aug 2021 | 26 |
| Jul 2021 | 19 |
| Jun 2021 | 19 |
| May 2021 | 13 |
| Apr 2021 | 21 |
| Mar 2021 | 17 |
| Feb 2021 | 23 |
| Jan 2021 | 13 |
| Dec 2020 | 10 |
| Nov 2020 | 13 |
| Oct 2020 | 13 |
| Sep 2020 | 8 |
| Aug 2020 | 5 |
| Jul 2020 | 9 |
| Jun 2020 | 8 |
| May 2020 | 2 |
| Apr 2020 | 1 |
| Mar 2020 | 5 |
| Feb 2020 | 4 |
| Jan 2020 | 4 |
| Dec 2019 | 2 |
| Nov 2019 | 4 |
| Oct 2019 | 1 |
| Sep 2019 | 4 |
| Aug 2019 | 9 |
| Jul 2019 | 8 |
| Jun 2019 | 6 |
| May 2019 | 8 |
| Apr 2019 | 5 |
| Mar 2019 | 7 |
| Feb 2019 | 4 |
| Jan 2019 | 6 |
| Dec 2018 | 4 |
| Nov 2018 | 8 |
| Oct 2018 | 8 |
| Sep 2018 | 7 |
| Aug 2018 | 9 |
| Jul 2018 | 6 |
| Jun 2018 | 11 |
| May 2018 | 1 |
| Apr 2018 | 5 |
| Mar 2018 | 8 |
| Feb 2018 | 3 |
| Jan 2018 | 1 |
| Dec 2017 | 4 |
| Nov 2017 | 5 |
| Oct 2017 | 2 |
| Sep 2017 | 3 |
| Aug 2017 | 3 |
| Jul 2017 | 9 |
| Jun 2017 | 5 |
| May 2017 | 6 |
| Apr 2017 | 2 |
| Mar 2017 | 4 |
| Feb 2017 | 1 |
| Jan 2017 | 2 |
Source: HDB. Data to Sep 2026.
It covers the 12 months to September 2026, against the 12 months before.
| Count | 12 months to Sep 2026 | 12 months to Sep 2025 |
|---|---|---|
| Island resales at S$1m or more | 1,847 | 1,528 |
| Toa Payoh | 293 | 298 |
| Toa Payoh share | 15.9% | 19.5% |
The island count rose 20.9% while Toa Payoh’s stayed level, so the share fell. Queenstown (250) and Bukit Merah (222) came next in the latest 12 months.
Within Toa Payoh, 29.2% of its 1,003 resales crossed S$1 million. For the wider trend see our guide to million-dollar flats.
Which flats cross the line
Of Toa Payoh’s 401 4-room resales, 205 (51.1%) sold for S$1 million or more. In 5-room flats it was 83 of 148 (56.1%), and 5 of 13 executive flats. Of the 205 4-room deals, 157 were 93 sq m flats.
By flat model, the 293 deals split into Model A (200), Improved (47) and DBSS (38). DBSS means Design, Build and Sell Scheme, a private-developer scheme for HDB flats that has ended.
Lease start matters more. In total, 164 (56.0%) had a lease start of 2020 or later. All 164 are on Bidadari Park Drive (114) and Alkaff Crescent (50), which HDB’s data places in Toa Payoh.
Another 38 are DBSS flats on Lorong 1A Toa Payoh with a 2012 lease start.
| 4-room lease start | Resales | Median price | At S$1m or more |
|---|---|---|---|
| 2020 or later | 161 | S$1,100,000 | 148 |
| 2015 to 2019 | 50 | S$1,030,000 | 31 |
| 2010 to 2014 | 11* | S$1,125,000 | 11 |
| 2005 to 2009 | 52 | S$960,000 | 15 |
| 1990 to 2004 | 46 | S$855,000 | 0 |
| 1980 to 1989 | 40 | S$668,000 | 0 |
| 1970 to 1979 | 41 | S$495,000 | 0 |
* Fewer than 30 resales. Older Toa Payoh flats sell for far less. The town contains the cheap and the dear, and the lease start tells you which is which.
What Toa Payoh flats sell and rent for
| Toa Payoh | Resales | Median price | Change | Rentals | Median rent | Change |
|---|---|---|---|---|---|---|
| 2-room | 21* | S$280,000 | −5.4% | 24* | S$2,300 | +4.5% |
| 3-room | 420 | S$380,000 | −4.5% | 873 | S$2,900 | 0.0% |
| 4-room | 401 | S$1,000,000 | +2.0% | 409 | S$3,700 | +2.8% |
| 5-room | 148 | S$1,050,000 | −2.3% | 206 | S$4,000 | 0.0% |
| Executive | 13* | S$988,000 | −8.1% | 18* | S$4,050 | +8.0% |
The 4-room median of S$1,000,000 is 58.7% above the island’s S$630,000. It changed by +2.0% on the 12 months before. The 3-room median of S$380,000 is 13.6% below the island’s S$440,000.
The 4-room rent of S$3,700 is 12.1% above the island’s S$3,300. So the rent premium is much smaller than the price premium.
A year of 4-room rent divided by the median price gives 4.4%, against 6.3% for the island. This is a rough ratio of two medians.
- Toa Payoh
- Island
Latest: Toa Payoh S$1,000,888 (Oct 2026), down 3.8% on Oct 2025; Island S$635,000 (Oct 2026), up 1.6% on Oct 2025.
Months with fewer than 3 resales are left out. The median moves with the mix of flats sold.
Table view
| Period | Toa Payoh | Island |
|---|---|---|
| Oct 2026 | S$1,000,888 | S$635,000 |
| Sep 2026 | S$1,045,000 | S$628,000 |
| Aug 2026 | S$1,040,000 | S$628,000 |
| Jul 2026 | S$1,000,000 | S$625,000 |
| Jun 2026 | S$1,029,000 | S$620,944 |
| May 2026 | S$985,000 | S$630,000 |
| Apr 2026 | S$979,444 | S$638,000 |
| Mar 2026 | S$1,012,500 | S$633,500 |
| Feb 2026 | S$1,005,000 | S$620,000 |
| Jan 2026 | S$960,000 | S$625,000 |
| Dec 2025 | S$1,076,500 | S$631,000 |
| Nov 2025 | S$868,000 | S$625,888 |
| Oct 2025 | S$1,040,000 | S$625,000 |
| Sep 2025 | S$1,020,000 | S$640,000 |
| Aug 2025 | S$855,000 | S$627,000 |
| Jul 2025 | S$1,002,000 | S$625,000 |
| Jun 2025 | S$1,031,000 | S$635,000 |
| May 2025 | S$999,444 | S$630,000 |
| Apr 2025 | S$988,000 | S$630,888 |
| Mar 2025 | S$959,188 | S$628,000 |
| Feb 2025 | S$905,000 | S$623,800 |
| Jan 2025 | S$968,000 | S$618,000 |
| Dec 2024 | S$970,888 | S$620,000 |
| Nov 2024 | S$950,000 | S$603,500 |
| Oct 2024 | S$932,000 | S$618,944 |
| Sep 2024 | S$840,000 | S$610,000 |
| Aug 2024 | S$838,000 | S$595,000 |
| Jul 2024 | S$855,000 | S$600,000 |
| Jun 2024 | S$835,000 | S$590,000 |
| May 2024 | S$879,000 | S$580,000 |
| Apr 2024 | S$765,400 | S$569,444 |
| Mar 2024 | S$808,250 | S$570,000 |
| Feb 2024 | S$760,000 | S$570,000 |
| Jan 2024 | S$843,800 | S$565,000 |
| Dec 2023 | S$760,000 | S$564,000 |
| Nov 2023 | S$810,000 | S$560,000 |
| Oct 2023 | S$675,000 | S$558,000 |
| Sep 2023 | S$816,888 | S$555,000 |
| Aug 2023 | S$730,000 | S$559,444 |
| Jul 2023 | S$770,000 | S$550,000 |
| Jun 2023 | S$760,000 | S$545,000 |
| May 2023 | S$730,000 | S$550,000 |
| Apr 2023 | S$626,344 | S$540,000 |
| Mar 2023 | S$763,000 | S$544,400 |
| Feb 2023 | S$795,250 | S$535,000 |
| Jan 2023 | S$805,000 | S$530,000 |
| Dec 2022 | S$736,500 | S$530,000 |
| Nov 2022 | S$748,500 | S$530,000 |
| Oct 2022 | S$844,444 | S$530,000 |
| Sep 2022 | S$715,000 | S$523,888 |
| Aug 2022 | S$763,000 | S$515,000 |
| Jul 2022 | S$730,000 | S$520,000 |
| Jun 2022 | S$739,444 | S$510,000 |
| May 2022 | S$670,000 | S$510,044 |
| Apr 2022 | S$715,000 | S$503,000 |
| Mar 2022 | S$662,500 | S$500,000 |
| Feb 2022 | S$575,000 | S$485,000 |
| Jan 2022 | S$630,000 | S$490,000 |
| Dec 2021 | S$610,000 | S$490,000 |
| Nov 2021 | S$532,500 | S$488,000 |
| Oct 2021 | S$637,500 | S$488,000 |
| Sep 2021 | S$621,000 | S$480,000 |
| Aug 2021 | S$538,000 | S$475,500 |
| Jul 2021 | S$623,750 | S$468,000 |
| Jun 2021 | S$655,000 | S$470,000 |
| May 2021 | S$714,000 | S$470,000 |
| Apr 2021 | S$580,000 | S$460,000 |
| Mar 2021 | S$683,000 | S$455,000 |
| Feb 2021 | S$647,000 | S$448,000 |
| Jan 2021 | S$550,000 | S$448,000 |
| Dec 2020 | S$569,000 | S$440,000 |
| Nov 2020 | S$443,000 | S$430,000 |
| Oct 2020 | S$627,500 | S$436,000 |
| Sep 2020 | S$681,000 | S$420,000 |
| Aug 2020 | S$490,000 | S$418,000 |
| Jul 2020 | S$480,000 | S$410,000 |
| Jun 2020 | S$647,500 | S$409,000 |
| May 2020 | S$420,000 | S$422,000 |
| Apr 2020 | – | S$410,000 |
| Mar 2020 | S$560,000 | S$410,000 |
| Feb 2020 | S$585,000 | S$400,000 |
| Jan 2020 | S$485,000 | S$395,000 |
| Dec 2019 | S$485,000 | S$405,000 |
| Nov 2019 | S$496,000 | S$405,000 |
| Oct 2019 | S$505,666 | S$400,000 |
| Sep 2019 | S$527,500 | S$397,000 |
| Aug 2019 | S$555,000 | S$400,000 |
| Jul 2019 | S$561,500 | S$400,000 |
| Jun 2019 | S$618,500 | S$400,000 |
| May 2019 | S$570,000 | S$395,000 |
| Apr 2019 | S$630,000 | S$398,500 |
| Mar 2019 | S$588,000 | S$400,000 |
| Feb 2019 | S$546,000 | S$393,888 |
| Jan 2019 | S$560,000 | S$395,000 |
| Dec 2018 | S$520,000 | S$395,000 |
| Nov 2018 | S$620,000 | S$395,000 |
| Oct 2018 | S$460,000 | S$396,000 |
| Sep 2018 | S$585,000 | S$400,000 |
| Aug 2018 | S$670,000 | S$400,000 |
| Jul 2018 | S$590,000 | S$405,000 |
| Jun 2018 | S$530,000 | S$405,000 |
| May 2018 | S$724,000 | S$400,000 |
| Apr 2018 | S$600,000 | S$405,000 |
| Mar 2018 | S$624,000 | S$410,000 |
| Feb 2018 | S$488,000 | S$400,000 |
| Jan 2018 | S$579,444 | S$410,000 |
| Dec 2017 | S$505,000 | S$405,000 |
| Nov 2017 | S$620,000 | S$407,000 |
| Oct 2017 | S$648,000 | S$400,000 |
| Sep 2017 | S$700,000 | S$410,000 |
| Aug 2017 | S$605,000 | S$414,000 |
| Jul 2017 | S$566,000 | S$400,004 |
| Jun 2017 | S$542,500 | S$408,000 |
| May 2017 | S$547,500 | S$408,000 |
| Apr 2017 | S$539,000 | S$400,000 |
| Mar 2017 | S$575,000 | S$418,000 |
| Feb 2017 | S$645,000 | S$408,000 |
| Jan 2017 | S$677,944 | S$410,000 |
Source: HDB. Data to Oct 2026.
Latest: Rent S$3,800 (Sep 2026), up 5.6% on Sep 2025.
Rents are declared by owners and are not verified by HDB. Months with fewer than 3 approvals are left out.
Table view
| Period | Toa Payoh 4-room rent |
|---|---|
| Sep 2026 | S$3,800 |
| Aug 2026 | S$4,000 |
| Jul 2026 | S$3,425 |
| Jun 2026 | S$4,000 |
| May 2026 | S$3,700 |
| Apr 2026 | S$3,700 |
| Mar 2026 | S$3,800 |
| Feb 2026 | S$3,700 |
| Jan 2026 | S$3,700 |
| Dec 2025 | S$3,600 |
| Nov 2025 | S$3,450 |
| Oct 2025 | S$3,600 |
| Sep 2025 | S$3,600 |
| Aug 2025 | S$3,800 |
| Jul 2025 | S$3,600 |
| Jun 2025 | S$3,500 |
| May 2025 | S$3,600 |
| Apr 2025 | S$3,700 |
| Mar 2025 | S$3,500 |
| Feb 2025 | S$3,800 |
| Jan 2025 | S$3,500 |
| Dec 2024 | S$3,525 |
| Nov 2024 | S$3,600 |
| Oct 2024 | S$3,200 |
| Sep 2024 | S$3,600 |
| Aug 2024 | S$3,600 |
| Jul 2024 | S$4,000 |
| Jun 2024 | S$3,600 |
| May 2024 | S$3,500 |
| Apr 2024 | S$3,200 |
| Mar 2024 | S$3,650 |
| Feb 2024 | S$3,700 |
| Jan 2024 | S$3,400 |
| Dec 2023 | S$3,450 |
| Nov 2023 | S$3,800 |
| Oct 2023 | S$3,350 |
| Sep 2023 | S$3,600 |
| Aug 2023 | S$3,600 |
| Jul 2023 | S$3,150 |
| Jun 2023 | S$3,525 |
| May 2023 | S$3,400 |
| Apr 2023 | S$3,600 |
| Mar 2023 | S$3,250 |
| Feb 2023 | S$3,000 |
| Jan 2023 | S$3,500 |
| Dec 2022 | S$3,700 |
| Nov 2022 | S$3,494 |
| Oct 2022 | S$3,000 |
| Sep 2022 | S$2,700 |
| Aug 2022 | S$3,000 |
| Jul 2022 | S$2,700 |
| Jun 2022 | S$2,600 |
| May 2022 | S$2,600 |
| Apr 2022 | S$2,500 |
| Mar 2022 | S$2,500 |
| Feb 2022 | S$2,400 |
| Jan 2022 | S$2,425 |
| Dec 2021 | S$2,550 |
| Nov 2021 | S$2,500 |
| Oct 2021 | S$2,400 |
| Sep 2021 | S$2,400 |
| Aug 2021 | S$2,250 |
| Jul 2021 | S$2,300 |
| Jun 2021 | S$2,400 |
| May 2021 | S$2,300 |
| Apr 2021 | S$2,400 |
| Mar 2021 | S$2,250 |
| Feb 2021 | S$2,350 |
| Jan 2021 | S$2,300 |
Source: HDB. Data to Sep 2026.
How Toa Payoh compares with every other HDB town:
4-room resale price
Median price, high to low. Toa Payoh is 2nd of 25.
- 1QueenstownS$1,028,000
- 2Toa PayohS$1,000,000
- 3Bukit MerahS$935,000
- 4Kallang/WhampoaS$905,000
- 5Central AreaS$870,000
- 6ClementiS$821,500
- 7BishanS$788,000
- 8GeylangS$740,000
- 9PunggolS$680,000
- 10TampinesS$665,000
- 11SerangoonS$660,000
- 12Marine ParadeS$645,000
- 13SengkangS$640,000
- 14Pasir RisS$635,000
- 15Bukit BatokS$630,000
- 16HougangS$618,888
- 17Ang Mo KioS$615,000
- 18SembawangS$600,000
- 19BedokS$594,000
- 20Bukit PanjangS$570,000
- 21Choa Chu KangS$555,000
- 22WoodlandsS$550,000
- 23YishunS$550,000
- 24Jurong EastS$548,000
- 25Jurong WestS$535,000
Island median: S$630,000
Not ranked (fewer than 30 cases): Bukit Timah.
4-room monthly rent
Median rent, high to low. Toa Payoh is 7th of 26.
- 1Central AreaS$4,450
- 2QueenstownS$4,150
- 3ClementiS$4,000
- 4Bukit MerahS$3,900
- 5Kallang/WhampoaS$3,800
- 6Bukit TimahS$3,700
- 7Toa PayohS$3,700
- 8BishanS$3,650
- 9GeylangS$3,600
- 10Jurong EastS$3,500
- 11Jurong WestS$3,500
- 12Marine ParadeS$3,500
- 13Ang Mo KioS$3,400
- 14SerangoonS$3,400
- 15TampinesS$3,400
- 16BedokS$3,380
- 17Pasir RisS$3,325
- 18Bukit BatokS$3,300
- 19PunggolS$3,250
- 20HougangS$3,200
- 21SengkangS$3,200
- 22Choa Chu KangS$3,100
- 23SembawangS$3,100
- 24WoodlandsS$3,100
- 25YishunS$3,100
- 26Bukit PanjangS$3,000
Island median: S$3,300
Twelve months to September 2026. Bars start above zero so that gaps show; compare the figures, not the bar lengths. Medians of HDB resale registrations and renting-out approvals, calculated by Propwise from HDB data on data.gov.sg. Rents are declared by owners and not verified by HDB.
The condos in District 12
URA’s list of postal districts names postal district 12 as Balestier, Toa Payoh and Serangoon (postal sectors 31, 32 and 33). The street names on its caveats also show Whampoa. A caveat is the legal notice filed when a sale is made.
Whampoa East (268), Balestier Road (195), Mar Thoma Road (155) and Lorong 3 Toa Payoh (128) lead. Figures are Propwise medians of URA private resale caveats (non-landed, no ECs) from the URA Data Service, not the URA index. ECs are executive condominiums.
| Quarter | District 12 resale caveats | Median price per sq ft |
|---|---|---|
| Q3 2025 | 121 | S$1,721.4 |
| Q4 2025 | 97 | S$1,753.5 |
| Q1 2026 | 75 | S$1,691.3 |
| Q2 2026 | 99 | S$1,791.7 |
| Q3 2026 | 103 | S$1,722.5 |
As at Q3 2026 the district median was S$1,722.5 per sq ft for private non-landed resales, up 0.1% year-on-year (on Q3 2025) and down quarter-on-quarter (from Q2 2026).
Of the district’s 2,005 resale caveats since September 2021, 1,303 (65.0%) are freehold. Streets named Toa Payoh (Lorong 1, 3 and 5) account for 276, or 13.8%.
They show 65 caveats from Q3 2025 to Q2 2026 at a pooled median of S$2,003.9. That figure is only indicative, because each quarter has fewer than 30.
What is behind Toa Payoh’s million-dollar deals
The data shows where the S$1 million deals are. Four forces explain most of it.
1. Bidadari flats coming out of MOP.
MOP is the minimum occupation period, the years an owner must stay before selling. ERA’s Q2 2026 report counts 66 million-dollar deals in Toa Payoh in Q2 2026, the most of any town. Most were at Bidadari Park Drive and Alkaff Crescent.
ERA also reports that 38 four- and five-room flats aged five to seven years sold for S$1 million to S$1.38 million in the quarter. ERA’s Eugene Lim said newer MOP flats have widened the pool of homes that can reach S$1 million. That matches our count of 164 deals from 2020-start flats.
The records come from the same blocks. PropertyNet reported a S$1.368 million 4-room sale at Alkaff Lakeview (31 May 2026). EdgeProp reported a record S$945,000 for a 3-room flat at 118A Alkaff Crescent (30 June 2026).
2. Location, schools and lease (portal and press view). EdgeProp ties Bidadari prices to Woodleigh and Potong Pasir MRT stations and nearby schools.
PropertyNet adds a lease of over 90 years and condos nearby above S$1,800 per sq ft. These are reasons buyers give, not measured effects.
3. A town of two ages. HDB’s property information file puts 52.0% of the flats HDB lists as sold in Toa Payoh at completion before 1990.
It puts 28.3% in 2015 or later. One town, two generations, and a price gap to match.
Dollars and Sense (11 June 2026) notes that about half of the town’s flats were built as 3-room, many with under 50 years of lease left. This is why the 3-room median is low while the 4-room median is S$1,000,000.
4. Why the share fell. The island count of S$1 million deals rose 20.9% while Toa Payoh’s stayed level. ERA says Clementi had 30 million-dollar deals and Bedok 27 in Q2 2026, so more towns now reach the line.
Huttons’ Lee Sze Teck said easing prices at the top end likely reflect buyer resistance (EdgeProp, 24 July 2026). The same report puts 1,594 Toa Payoh flats reaching MOP in 2026.
More supply of newer flats could cap prices, or it could add more million-dollar deals. Analysts do not agree, and nobody has shown which.
Limits
- A S$1 million price is a threshold, not a measure of quality. A flat just below it is not a different kind of flat.
- A 12-month median moves with the mix of flats sold. Toa Payoh mixes new and old flats, as our lease guide explains.
- Counts below 30 are only a guide. Neither source describes one block, so see how to choose an HDB flat.
- HDB counts by registration month. Condo figures are caveat prices.