HDB Flats Sold for S$1 Million or More: 208 in September 2026
208 HDB flats sold for S$1 million or more in September 2026, about 21% more than a year earlier. What the count measures and what it cannot show.
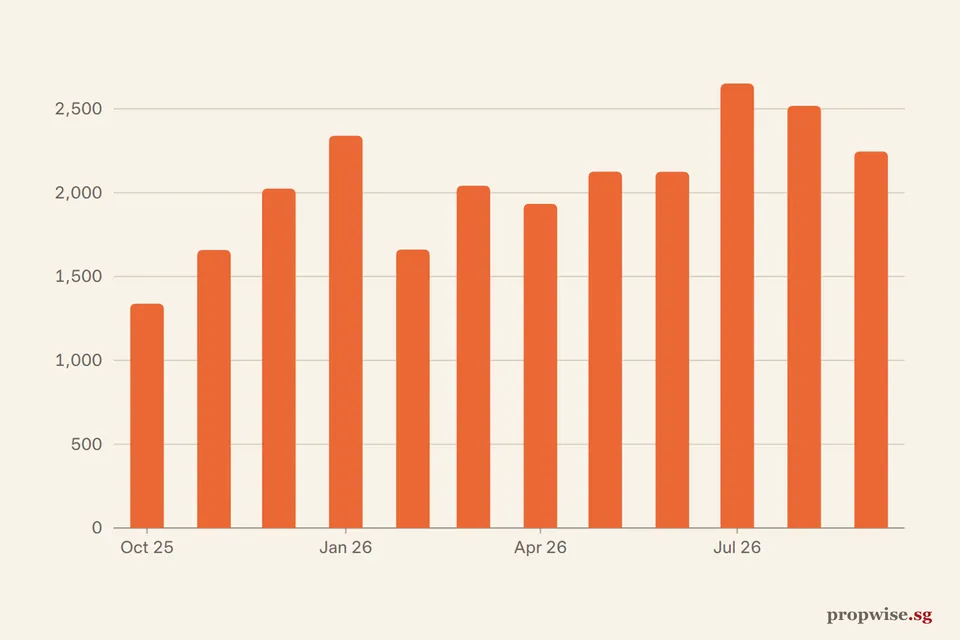
208 HDB flats sold for S$1 million or more in Sep 2026. That is the highest monthly count in our series, which starts in January 2017. It is 20.9% above the count a year earlier.
These flats were 9.3% of all HDB resales that month. The count rose from 201 in the month before. This issue explains how we count, shows the last 12 months, and says what the number cannot tell you.
Latest: S$1m+ 208 (Sep 2026).
Counts are by registration month. A month appears once it is complete.
Table view
| Period | Resales at S$1 million or more |
|---|---|
| Sep 2026 | 208 |
| Aug 2026 | 201 |
| Jul 2026 | 187 |
| Jun 2026 | 188 |
| May 2026 | 165 |
| Apr 2026 | 137 |
| Mar 2026 | 144 |
| Feb 2026 | 122 |
| Jan 2026 | 145 |
| Dec 2025 | 144 |
| Nov 2025 | 120 |
| Oct 2025 | 86 |
| Sep 2025 | 172 |
| Aug 2025 | 141 |
| Jul 2025 | 167 |
| Jun 2025 | 132 |
| May 2025 | 142 |
| Apr 2025 | 141 |
| Mar 2025 | 108 |
| Feb 2025 | 121 |
| Jan 2025 | 119 |
| Dec 2024 | 95 |
| Nov 2024 | 87 |
| Oct 2024 | 103 |
| Sep 2024 | 106 |
| Aug 2024 | 105 |
| Jul 2024 | 120 |
| Jun 2024 | 95 |
| May 2024 | 73 |
| Apr 2024 | 68 |
| Mar 2024 | 60 |
| Feb 2024 | 49 |
| Jan 2024 | 74 |
| Dec 2023 | 48 |
| Nov 2023 | 45 |
| Oct 2023 | 40 |
| Sep 2023 | 42 |
| Aug 2023 | 54 |
| Jul 2023 | 32 |
| Jun 2023 | 34 |
| May 2023 | 34 |
| Apr 2023 | 37 |
| Mar 2023 | 39 |
| Feb 2023 | 24 |
| Jan 2023 | 40 |
| Dec 2022 | 28 |
| Nov 2022 | 26 |
| Oct 2022 | 38 |
| Sep 2022 | 45 |
| Aug 2022 | 33 |
| Jul 2022 | 33 |
| Jun 2022 | 31 |
| May 2022 | 30 |
| Apr 2022 | 22 |
| Mar 2022 | 27 |
| Feb 2022 | 29 |
| Jan 2022 | 27 |
| Dec 2021 | 36 |
| Nov 2021 | 29 |
| Oct 2021 | 20 |
| Sep 2021 | 23 |
| Aug 2021 | 26 |
| Jul 2021 | 19 |
| Jun 2021 | 19 |
| May 2021 | 13 |
| Apr 2021 | 21 |
| Mar 2021 | 17 |
| Feb 2021 | 23 |
| Jan 2021 | 13 |
| Dec 2020 | 10 |
| Nov 2020 | 13 |
| Oct 2020 | 13 |
| Sep 2020 | 8 |
| Aug 2020 | 5 |
| Jul 2020 | 9 |
| Jun 2020 | 8 |
| May 2020 | 2 |
| Apr 2020 | 1 |
| Mar 2020 | 5 |
| Feb 2020 | 4 |
| Jan 2020 | 4 |
| Dec 2019 | 2 |
| Nov 2019 | 4 |
| Oct 2019 | 1 |
| Sep 2019 | 4 |
| Aug 2019 | 9 |
| Jul 2019 | 8 |
| Jun 2019 | 6 |
| May 2019 | 8 |
| Apr 2019 | 5 |
| Mar 2019 | 7 |
| Feb 2019 | 4 |
| Jan 2019 | 6 |
| Dec 2018 | 4 |
| Nov 2018 | 8 |
| Oct 2018 | 8 |
| Sep 2018 | 7 |
| Aug 2018 | 9 |
| Jul 2018 | 6 |
| Jun 2018 | 11 |
| May 2018 | 1 |
| Apr 2018 | 5 |
| Mar 2018 | 8 |
| Feb 2018 | 3 |
| Jan 2018 | 1 |
| Dec 2017 | 4 |
| Nov 2017 | 5 |
| Oct 2017 | 2 |
| Sep 2017 | 3 |
| Aug 2017 | 3 |
| Jul 2017 | 9 |
| Jun 2017 | 5 |
| May 2017 | 6 |
| Apr 2017 | 2 |
| Mar 2017 | 4 |
| Feb 2017 | 1 |
| Jan 2017 | 2 |
Source: HDB. Data to Sep 2026.
How we count
Each HDB resale record is one resale. We count the records with a price of S$1,000,000 or more in each calendar month, by the month the resale was registered.
HDB’s notes say the file leaves out resales between relatives and partial-share resales. A month is counted only when it is complete, so the running month is not in the figures above.
The last 12 months
These are Propwise counts from the HDB file, all final, as at 5 October 2026:
| Month | Resales at S$1m or more | Share of all resales |
|---|---|---|
| Oct 2025 | 86 | 6.4% |
| Nov 2025 | 120 | 7.2% |
| Dec 2025 | 144 | 7.1% |
| Jan 2026 | 145 | 6.2% |
| Feb 2026 | 122 | 7.3% |
| Mar 2026 | 144 | 7.1% |
| Apr 2026 | 137 | 7.1% |
| May 2026 | 165 | 7.8% |
| Jun 2026 | 188 | 8.8% |
| Jul 2026 | 187 | 7.1% |
| Aug 2026 | 201 | 8.0% |
| Sep 2026 | 208 | 9.3% |
The count has been 187 or higher in each of the last four months. The 12 months to September 2026 add up to 1,847 flats, against 1,528 in the 12 months before, a rise of 20.9%.
Those 1,847 flats are 7.5% of the 24,661 resales in the period.
The longer run shows how new this is. The file has 46 such sales in all of 2017, 82 in 2020 and 1,035 in 2024. In 2025 it has 1,593.
The first nine months of 2026 already total 1,497, which is 94% of the 2025 figure (as at 5 October 2026). The million-dollar flat is no longer a rare bird. It is closer to a regular at the coffee shop.
Which flats these are
For the same 12 months to September 2026, we looked at each flat in the count (the HDB file):
- By flat type: 786 four-room flats (43%), 660 five-room flats (36%) and 390 executive flats (21%). The other 11 were three-room and multi-generation flats.
- By town: Toa Payoh had 293, Queenstown 250 and Bukit Merah 222. Together these three towns had 41% of the total.
Source: HDB. The count leaves out resales between relatives and partial-share resales. The other 509 flats were in towns not shown.
So the count is not spread evenly across the island. A rise in the count can come from more sales in a few towns, not from a general rise in every town.
For the wider picture on million-dollar flats, see our guide on whether they are the new norm. If you are comparing flats, see how to choose the right HDB flat and our HDB home loan guide.
What is behind the rise in million-dollar flats
The count rose while the overall market softened. Our guide to million-dollar flats as the new norm covers location, young leases and flat size, so we do not repeat them.
1. A fixed line meets rising prices. S$1 million does not change, but prices do. The HDB resale price index rose from 130.8 in Q2 2019 to 203.7 in Q3 2025, about 56%.
A flat that cost S$700,000 at the 2019 level would cost about S$1.09 million at the 2025 peak (a Propwise illustration). This cannot be the whole story. The index has slipped since Q3 2025, yet the count kept rising.
2. Young central flats are reaching their minimum occupation period (MOP). The MOP is the wait before an owner can sell on the open market. Huttons’ Lee Sze Teck said that flats reaching MOP in 2026 could draw interest, and that some central and 5-room flats may sell at S$1 million or more.
PropertyNet, a property portal, links the large Toa Payoh and Queenstown counts to the size of the MOP waves there, and does not prove the link.
3. Cash-rich private owners (analysts disagree).
ERA’s Eugene Lim put part of the demand down to private homeowners facing fewer barriers. The 15-month wait-out ended on 28 July 2026. Two things argue against this as the main cause.
HDB says it has not seen a significant rise in purchases by that group, as our resale price index article reports. And the table above shows 188 in June 2026 and 187 in July, so the count was high before the rule changed.
4. Spread beyond mature towns (measured by an analyst). Lee of Huttons said non-mature estates made up 11.4% of million-dollar deals in Q3 2026, the highest so far. ERA counts 597 such deals in Q3, 8.5% of 7,528 resales, with 353 in 5-room and larger flats.
A force that may slow it.
The BTO (Build-To-Order) income ceiling rose to S$16,000 for couples in August 2026.
Realion’s Christine Sun expects it to divert buyers from larger, dearer resale flats. That is a forecast. No data yet shows it.
What is not known. The count cannot show who bought, how they paid or whether sellers priced above valuation.