HDB resale volume: 2,245 flats in September, 3.3% above a year ago
HDB registered 2,245 resale flats in September 2026. What the monthly count measures, the last 12 months, its link to S$1 million sales, and its limits.
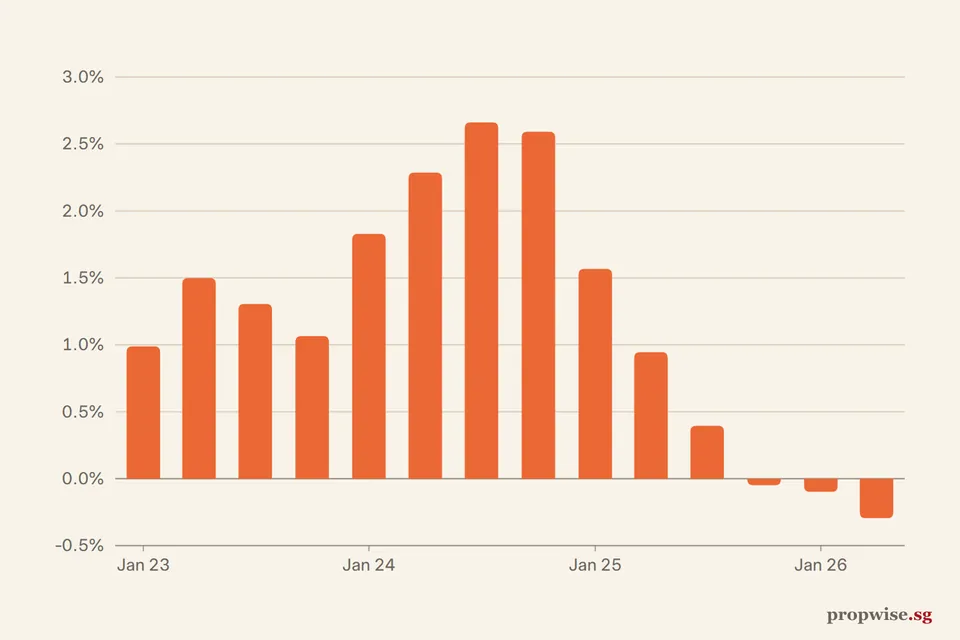
HDB registered 2,245 resale flats in Sep 2026. That is +3.3% on a year earlier and -10.8% on the month before.
Over the last 12 months, volume is 6.0% lower than in the 12 months before. Yet sales at S$1 million or more rose 20.9%.
What the number counts
The series counts HDB resale flats registered in the month, all flat types and all towns.
Read it as a count of flats that changed owners and were registered in the month. A higher count means more registrations.
It does not mean higher prices, and it does not say how many flats were listed or viewed. Think of it as a turnstile at a gate: it counts who walked through, not who stood outside looking.
Latest: Resales 2,245 (Sep 2026).
Counts are by registration month. A month appears once it is complete.
Table view
| Period | Resale transactions |
|---|---|
| Sep 2026 | 2,245 |
| Aug 2026 | 2,518 |
| Jul 2026 | 2,649 |
| Jun 2026 | 2,125 |
| May 2026 | 2,126 |
| Apr 2026 | 1,933 |
| Mar 2026 | 2,042 |
| Feb 2026 | 1,661 |
| Jan 2026 | 2,339 |
| Dec 2025 | 2,024 |
| Nov 2025 | 1,658 |
| Oct 2025 | 1,338 |
| Sep 2025 | 2,174 |
| Aug 2025 | 2,203 |
| Jul 2025 | 2,562 |
| Jun 2025 | 2,260 |
| May 2025 | 2,266 |
| Apr 2025 | 2,297 |
| Mar 2025 | 1,899 |
| Feb 2025 | 2,091 |
| Jan 2025 | 2,313 |
| Dec 2024 | 2,112 |
| Nov 2024 | 1,929 |
| Oct 2024 | 2,139 |
| Sep 2024 | 2,204 |
| Aug 2024 | 2,591 |
| Jul 2024 | 3,036 |
| Jun 2024 | 2,171 |
| May 2024 | 2,490 |
| Apr 2024 | 2,370 |
| Mar 2024 | 2,046 |
| Feb 2024 | 2,123 |
| Jan 2024 | 2,621 |
| Dec 2023 | 2,004 |
| Nov 2023 | 2,128 |
| Oct 2023 | 2,189 |
| Sep 2023 | 1,974 |
| Aug 2023 | 2,467 |
| Jul 2023 | 2,052 |
| Jun 2023 | 1,853 |
| May 2023 | 2,245 |
| Apr 2023 | 2,177 |
| Mar 2023 | 2,277 |
| Feb 2023 | 1,837 |
| Jan 2023 | 2,551 |
| Dec 2022 | 2,234 |
| Nov 2022 | 2,130 |
| Oct 2022 | 1,958 |
| Sep 2022 | 2,578 |
| Aug 2022 | 2,309 |
| Jul 2022 | 2,361 |
| Jun 2022 | 2,135 |
| May 2022 | 2,154 |
| Apr 2022 | 2,262 |
| Mar 2022 | 2,262 |
| Feb 2022 | 1,895 |
| Jan 2022 | 2,442 |
| Dec 2021 | 2,422 |
| Nov 2021 | 2,566 |
| Oct 2021 | 2,499 |
| Sep 2021 | 2,516 |
| Aug 2021 | 2,739 |
| Jul 2021 | 2,659 |
| Jun 2021 | 2,302 |
| May 2021 | 1,957 |
| Apr 2021 | 2,333 |
| Mar 2021 | 2,443 |
| Feb 2021 | 2,160 |
| Jan 2021 | 2,491 |
| Dec 2020 | 2,486 |
| Nov 2020 | 2,322 |
| Oct 2020 | 2,427 |
| Sep 2020 | 2,482 |
| Aug 2020 | 2,426 |
| Jul 2020 | 2,456 |
| Jun 2020 | 2,438 |
| May 2020 | 363 |
| Apr 2020 | 424 |
| Mar 2020 | 1,937 |
| Feb 2020 | 1,661 |
| Jan 2020 | 1,911 |
| Dec 2019 | 1,848 |
| Nov 2019 | 1,910 |
| Oct 2019 | 2,206 |
| Sep 2019 | 1,830 |
| Aug 2019 | 1,902 |
| Jul 2019 | 2,114 |
| Jun 2019 | 1,884 |
| May 2019 | 2,070 |
| Apr 2019 | 1,915 |
| Mar 2019 | 1,653 |
| Feb 2019 | 1,304 |
| Jan 2019 | 1,550 |
| Dec 2018 | 1,423 |
| Nov 2018 | 1,866 |
| Oct 2018 | 1,992 |
| Sep 2018 | 1,985 |
| Aug 2018 | 2,067 |
| Jul 2018 | 2,539 |
| Jun 2018 | 1,975 |
| May 2018 | 1,740 |
| Apr 2018 | 1,838 |
| Mar 2018 | 1,881 |
| Feb 2018 | 1,183 |
| Jan 2018 | 1,072 |
| Dec 2017 | 1,585 |
| Nov 2017 | 1,980 |
| Oct 2017 | 1,785 |
| Sep 2017 | 1,680 |
| Aug 2017 | 1,960 |
| Jul 2017 | 1,780 |
| Jun 2017 | 1,747 |
| May 2017 | 1,980 |
| Apr 2017 | 1,839 |
| Mar 2017 | 1,903 |
| Feb 2017 | 1,085 |
| Jan 2017 | 1,185 |
Source: HDB. Data to Sep 2026.
The last 12 months
The 12 months to September 2026 had 24,658 resales, against 26,245 in the 12 months before. That is a fall of 6.0%.
From January to September 2026 the count was 19,638, against 20,065 a year earlier, a fall of 2.1%.
By our count, September 2026 ranks 41st highest of the 117 months since January 2017.
The highest month in the series is July 2024, at 3,036. October 2025, at 1,338, is the lowest of the last 36 months.
Latest: Resales 2,245 (Sep 2026).
Counts are by registration month. A month appears once it is complete.
Table view
| Period | Resale transactions |
|---|---|
| Sep 2026 | 2,245 |
| Aug 2026 | 2,518 |
| Jul 2026 | 2,649 |
| Jun 2026 | 2,125 |
| May 2026 | 2,126 |
| Apr 2026 | 1,933 |
| Mar 2026 | 2,042 |
| Feb 2026 | 1,661 |
| Jan 2026 | 2,339 |
| Dec 2025 | 2,024 |
| Nov 2025 | 1,658 |
| Oct 2025 | 1,338 |
Source: HDB. Data to Sep 2026.
| Month | Resales | At S$1m or more | Share at S$1m or more |
|---|---|---|---|
| Oct 2025 | 1,338 | 86 | 6.4% |
| Nov 2025 | 1,658 | 120 | 7.2% |
| Dec 2025 | 2,024 | 144 | 7.1% |
| Jan 2026 | 2,339 | 145 | 6.2% |
| Feb 2026 | 1,661 | 122 | 7.3% |
| Mar 2026 | 2,042 | 144 | 7.1% |
| Apr 2026 | 1,933 | 137 | 7.1% |
| May 2026 | 2,126 | 165 | 7.8% |
| Jun 2026 | 2,125 | 188 | 8.8% |
| Jul 2026 | 2,649 | 187 | 7.1% |
| Aug 2026 | 2,518 | 201 | 8.0% |
| Sep 2026 | 2,245 | 208 | 9.3% |
How it links to S$1 million sales
The S$1 million count and the total count do not move together. The 12-month count of S$1m resales was 1,847, against 1,528 a year earlier, up 20.9%. Their share of all resales rose from 5.8% to 7.5%.
The latest month, Sep 2026, had 208 such sales, a share of 9.3%.
Latest: S$1m+ 208 (Sep 2026).
Counts are by registration month. A month appears once it is complete.
Table view
| Period | Resales at S$1 million or more |
|---|---|
| Sep 2026 | 208 |
| Aug 2026 | 201 |
| Jul 2026 | 187 |
| Jun 2026 | 188 |
| May 2026 | 165 |
| Apr 2026 | 137 |
| Mar 2026 | 144 |
| Feb 2026 | 122 |
| Jan 2026 | 145 |
| Dec 2025 | 144 |
| Nov 2025 | 120 |
| Oct 2025 | 86 |
| Sep 2025 | 172 |
| Aug 2025 | 141 |
| Jul 2025 | 167 |
| Jun 2025 | 132 |
| May 2025 | 142 |
| Apr 2025 | 141 |
| Mar 2025 | 108 |
| Feb 2025 | 121 |
| Jan 2025 | 119 |
| Dec 2024 | 95 |
| Nov 2024 | 87 |
| Oct 2024 | 103 |
| Sep 2024 | 106 |
| Aug 2024 | 105 |
| Jul 2024 | 120 |
| Jun 2024 | 95 |
| May 2024 | 73 |
| Apr 2024 | 68 |
| Mar 2024 | 60 |
| Feb 2024 | 49 |
| Jan 2024 | 74 |
| Dec 2023 | 48 |
| Nov 2023 | 45 |
| Oct 2023 | 40 |
| Sep 2023 | 42 |
| Aug 2023 | 54 |
| Jul 2023 | 32 |
| Jun 2023 | 34 |
| May 2023 | 34 |
| Apr 2023 | 37 |
| Mar 2023 | 39 |
| Feb 2023 | 24 |
| Jan 2023 | 40 |
| Dec 2022 | 28 |
| Nov 2022 | 26 |
| Oct 2022 | 38 |
| Sep 2022 | 45 |
| Aug 2022 | 33 |
| Jul 2022 | 33 |
| Jun 2022 | 31 |
| May 2022 | 30 |
| Apr 2022 | 22 |
| Mar 2022 | 27 |
| Feb 2022 | 29 |
| Jan 2022 | 27 |
| Dec 2021 | 36 |
| Nov 2021 | 29 |
| Oct 2021 | 20 |
| Sep 2021 | 23 |
| Aug 2021 | 26 |
| Jul 2021 | 19 |
| Jun 2021 | 19 |
| May 2021 | 13 |
| Apr 2021 | 21 |
| Mar 2021 | 17 |
| Feb 2021 | 23 |
| Jan 2021 | 13 |
| Dec 2020 | 10 |
| Nov 2020 | 13 |
| Oct 2020 | 13 |
| Sep 2020 | 8 |
| Aug 2020 | 5 |
| Jul 2020 | 9 |
| Jun 2020 | 8 |
| May 2020 | 2 |
| Apr 2020 | 1 |
| Mar 2020 | 5 |
| Feb 2020 | 4 |
| Jan 2020 | 4 |
| Dec 2019 | 2 |
| Nov 2019 | 4 |
| Oct 2019 | 1 |
| Sep 2019 | 4 |
| Aug 2019 | 9 |
| Jul 2019 | 8 |
| Jun 2019 | 6 |
| May 2019 | 8 |
| Apr 2019 | 5 |
| Mar 2019 | 7 |
| Feb 2019 | 4 |
| Jan 2019 | 6 |
| Dec 2018 | 4 |
| Nov 2018 | 8 |
| Oct 2018 | 8 |
| Sep 2018 | 7 |
| Aug 2018 | 9 |
| Jul 2018 | 6 |
| Jun 2018 | 11 |
| May 2018 | 1 |
| Apr 2018 | 5 |
| Mar 2018 | 8 |
| Feb 2018 | 3 |
| Jan 2018 | 1 |
| Dec 2017 | 4 |
| Nov 2017 | 5 |
| Oct 2017 | 2 |
| Sep 2017 | 3 |
| Aug 2017 | 3 |
| Jul 2017 | 9 |
| Jun 2017 | 5 |
| May 2017 | 6 |
| Apr 2017 | 2 |
| Mar 2017 | 4 |
| Feb 2017 | 1 |
| Jan 2017 | 2 |
Source: HDB. Data to Sep 2026.
Three towns, Toa Payoh, Queenstown and Bukit Merah, recorded 765 of the 1,847, or 41.4%, in the latest 12 months. The data cannot say why the count rose. It may be prices, the mix of flats sold, or both.
Propwise count from HDB's resale file on data.gov.sg (Singapore Open Data Licence). The file leaves out resales between relatives and partial-share resales. The other 509 flats were in towns not shown.
What is behind the swings in resale volume
The count shows what happened, not why. Analysts point to three forces.
1. The supply of flats reaching their minimum occupation period (MOP). An owner can sell on the open market only after the MOP. Flats reaching a five-year MOP numbered 11,952 in 2024, 6,973 in 2025 and 13,484 in 2026.
Resale volume was 27,832 in 2024 and 25,085 in 2025, a fall of 9.9%. SRI’s Mohan Sandrasegeran said in December 2025 that fewer MOP flats in 2025 left buyers with less choice and lowered volume.
The link is loose. The MOP count also halved from 2022 to 2024, yet volume held between about 25,000 and 28,000 a year. HDB counts BTO flats separately: 8,000 reached MOP in 2025, with 13,500 expected in 2026.
Latest: Flats 19,379 (2030).
About figures: a Propwise count of flats by block completion year plus five, from HDB Property Information. It mixes BTO, SBF and other flats, and leaves out Plus and Prime flats (10-year MOP) and ECs. The year the key is collected is often one to two years after completion.
Table view
| Period | Flats reaching a 5-year MOP |
|---|---|
| 2030 | 19,379 |
| 2029 | 17,992 |
| 2028 | 21,393 |
| 2027 | 18,939 |
| 2026 | 13,484 |
| 2025 | 6,973 |
| 2024 | 11,952 |
| 2023 | 15,549 |
| 2022 | 30,918 |
| 2021 | 22,982 |
| 2020 | 22,587 |
| 2019 | 28,911 |
| 2018 | 14,391 |
| 2017 | 10,518 |
| 2016 | 16,775 |
| 2015 | 8,443 |
Source: HDB. Data to 2030.
2. More new flats compete with resale. In the same December 2025 report, ERA’s Eugene Lim tied weaker resale demand to a sharp rise in sale-of-balance flat supply. A buyer who can wait for a new flat does not need to buy resale.
The count cannot show who chose a new flat instead.
3. The 28 July 2026 rule change. HDB removed the 15-month wait-out period for private owners who buy a non-subsidised resale flat without an HDB loan, EdgeProp reports. Lim of ERA said the July lifting coincides with the Q3 rise in deals, which ERA counts at 7,528, up 17.7% on Q2.
He thinks right-sizers moved first, and ERA notes the 5-room and Executive flats rose most.
Our count is by registration month, which follows the contract. Deals agreed after 28 July register later, so the full effect, if any, may not show yet. Other analysts expect the change to add deals but not move prices much.
Limits
- Registration month, not contract month. HDB counts a resale when it registers, which is after the buyer and seller agree. A month’s count can therefore lag the market.
- Partial months. The month in progress is not in the series until it is complete, so the newest month shown is always the last full month.
- Months differ. They have different lengths and different numbers of working days.
- One count for all flats. It includes every flat type and town, so it hides the mix. For choosing a flat, see how to choose an HDB flat.