Ang Mo Kio HDB Resale Prices and Rents vs the Island
Ang Mo Kio HDB resale and rent medians for the latest 12 months, against the island, plus the District 20 condo price per sq ft by quarter.
A 4-room flat in Ang Mo Kio sold for a median S$620,000 in the 12 months to October 2026, against S$630,000 for the island. The Ang Mo Kio median changed by +4.0% on the 12 months before. Nearby, the condo median in postal district 20 was S$1,955.3 per sq ft in Q2 2026.
What Ang Mo Kio flats sell and rent for
Resales count by registration month and rents by approval month.
| Ang Mo Kio | Resales | Median price | Change | Rentals | Median rent | Change |
|---|---|---|---|---|---|---|
| 2-room | 26* | S$324,000 | −1.1% | 28* | S$2,300 | +4.5% |
| 3-room | 423 | S$430,000 | −2.0% | 1,283 | S$2,800 | 0.0% |
| 4-room | 287 | S$620,000 | +4.0% | 450 | S$3,400 | 0.0% |
| 5-room | 146 | S$981,500 | +8.8% | 190 | S$3,800 | +1.1% |
| Executive | 7* | S$1,201,888 | +8.8% | 6* | S$4,100 | 0.0% |
Ang Mo Kio recorded 889 resales in the window. That includes 287 4-room flats and 423 3-room flats.
Median 4-room rent was S$3,400 a month across 450 approvals. The change on the 12 months before was 0.0%. Owners declare these rents.
Latest: Rent S$3,500 (Oct 2026), up 2.9% on Oct 2025.
Rents are declared by owners and are not verified by HDB. Months with fewer than 3 approvals are left out.
Table view
| Period | Ang Mo Kio 4-room rent |
|---|---|
| Oct 2026 | S$3,500 |
| Sep 2026 | S$3,450 |
| Aug 2026 | S$3,500 |
| Jul 2026 | S$3,400 |
| Jun 2026 | S$3,500 |
| May 2026 | S$3,400 |
| Apr 2026 | S$3,500 |
| Mar 2026 | S$3,400 |
| Feb 2026 | S$3,600 |
| Jan 2026 | S$3,500 |
| Dec 2025 | S$3,300 |
| Nov 2025 | S$3,400 |
| Oct 2025 | S$3,400 |
| Sep 2025 | S$3,400 |
| Aug 2025 | S$3,400 |
| Jul 2025 | S$3,500 |
| Jun 2025 | S$3,380 |
| May 2025 | S$3,500 |
| Apr 2025 | S$3,500 |
| Mar 2025 | S$3,500 |
| Feb 2025 | S$3,200 |
| Jan 2025 | S$3,400 |
| Dec 2024 | S$3,350 |
| Nov 2024 | S$3,400 |
| Oct 2024 | S$3,400 |
| Sep 2024 | S$3,300 |
| Aug 2024 | S$3,200 |
| Jul 2024 | S$3,325 |
| Jun 2024 | S$3,300 |
| May 2024 | S$3,400 |
| Apr 2024 | S$3,500 |
| Mar 2024 | S$3,400 |
| Feb 2024 | S$3,500 |
| Jan 2024 | S$3,300 |
| Dec 2023 | S$3,200 |
| Nov 2023 | S$3,500 |
| Oct 2023 | S$3,200 |
| Sep 2023 | S$3,350 |
| Aug 2023 | S$3,400 |
| Jul 2023 | S$3,350 |
| Jun 2023 | S$3,200 |
| May 2023 | S$3,200 |
| Apr 2023 | S$3,500 |
| Mar 2023 | S$3,200 |
| Feb 2023 | S$3,200 |
| Jan 2023 | S$2,850 |
| Dec 2022 | S$2,900 |
| Nov 2022 | S$3,000 |
| Oct 2022 | S$2,800 |
| Sep 2022 | S$2,650 |
| Aug 2022 | S$2,600 |
| Jul 2022 | S$2,500 |
| Jun 2022 | S$2,500 |
| May 2022 | S$2,400 |
| Apr 2022 | S$2,300 |
| Mar 2022 | S$2,400 |
| Feb 2022 | S$2,300 |
| Jan 2022 | S$2,300 |
| Dec 2021 | S$2,300 |
| Nov 2021 | S$2,375 |
| Oct 2021 | S$2,300 |
| Sep 2021 | S$2,300 |
| Aug 2021 | S$2,200 |
| Jul 2021 | S$2,200 |
| Jun 2021 | S$2,200 |
| May 2021 | S$2,200 |
| Apr 2021 | S$2,100 |
| Mar 2021 | S$2,200 |
| Feb 2021 | S$2,140 |
| Jan 2021 | S$2,200 |
Source: HDB. Data to Oct 2026.
How Ang Mo Kio compares with every other HDB town:
4-room resale price
Median price, high to low. Ang Mo Kio is 16th of 25.
- 1QueenstownS$1,030,000
- 2Toa PayohS$1,000,888
- 3Bukit MerahS$938,000
- 4Kallang/WhampoaS$900,000
- 5Central AreaS$870,000
- 6ClementiS$801,500
- 7BishanS$788,000
- 8GeylangS$740,000
- 9PunggolS$680,000
- 10TampinesS$665,500
- 11SerangoonS$653,444
- 12SengkangS$640,000
- 13Marine ParadeS$637,500
- 14Pasir RisS$635,000
- 15Bukit BatokS$625,000
- 16Ang Mo KioS$620,000
- 17HougangS$618,888
- 18BedokS$600,000
- 19SembawangS$600,000
- 20Bukit PanjangS$570,000
- 21Choa Chu KangS$551,944
- 22YishunS$550,000
- 23Jurong EastS$549,444
- 24WoodlandsS$548,000
- 25Jurong WestS$534,500
Island median: S$630,000
Not ranked (fewer than 30 cases): Bukit Timah.
4-room monthly rent
Median rent, high to low. Ang Mo Kio is 14th of 26.
- 1Central AreaS$4,400
- 2QueenstownS$4,200
- 3ClementiS$4,000
- 4Bukit MerahS$3,950
- 5Kallang/WhampoaS$3,800
- 6Toa PayohS$3,700
- 7Bukit TimahS$3,675
- 8BishanS$3,650
- 9GeylangS$3,650
- 10Jurong EastS$3,500
- 11Jurong WestS$3,500
- 12Marine ParadeS$3,500
- 13TampinesS$3,420
- 14Ang Mo KioS$3,400
- 15BedokS$3,400
- 16SerangoonS$3,400
- 17Pasir RisS$3,350
- 18Bukit BatokS$3,300
- 19PunggolS$3,250
- 20HougangS$3,200
- 21SengkangS$3,200
- 22Choa Chu KangS$3,100
- 23SembawangS$3,100
- 24WoodlandsS$3,100
- 25YishunS$3,100
- 26Bukit PanjangS$3,000
Island median: S$3,350
Twelve months to October 2026. Bars start above zero so that gaps show; compare the figures, not the bar lengths. Medians of HDB resale registrations and renting-out approvals, calculated by Propwise from HDB data on data.gov.sg. Rents are declared by owners and not verified by HDB.
Ang Mo Kio against the island
- Ang Mo Kio
- Island
Latest: Ang Mo Kio S$612,000 (Oct 2026), up 4.8% on Oct 2025; Island S$628,844 (Oct 2026), up 0.6% on Oct 2025.
Months with fewer than 3 resales are left out. The median moves with the mix of flats sold.
Table view
| Period | Ang Mo Kio | Island |
|---|---|---|
| Oct 2026 | S$612,000 | S$628,844 |
| Sep 2026 | S$600,000 | S$628,000 |
| Aug 2026 | S$580,000 | S$628,000 |
| Jul 2026 | S$740,000 | S$625,000 |
| Jun 2026 | S$601,000 | S$620,944 |
| May 2026 | S$780,000 | S$630,000 |
| Apr 2026 | S$670,000 | S$638,000 |
| Mar 2026 | S$635,000 | S$633,500 |
| Feb 2026 | S$742,500 | S$620,000 |
| Jan 2026 | S$607,500 | S$625,000 |
| Dec 2025 | S$596,500 | S$631,000 |
| Nov 2025 | S$615,000 | S$625,888 |
| Oct 2025 | S$584,000 | S$625,000 |
| Sep 2025 | S$630,000 | S$640,000 |
| Aug 2025 | S$575,000 | S$627,000 |
| Jul 2025 | S$570,944 | S$625,000 |
| Jun 2025 | S$575,000 | S$635,000 |
| May 2025 | S$604,444 | S$630,000 |
| Apr 2025 | S$782,500 | S$630,888 |
| Mar 2025 | S$587,988 | S$628,000 |
| Feb 2025 | S$560,000 | S$623,800 |
| Jan 2025 | S$588,500 | S$618,000 |
| Dec 2024 | S$600,000 | S$620,000 |
| Nov 2024 | S$598,000 | S$603,500 |
| Oct 2024 | S$580,000 | S$618,944 |
| Sep 2024 | S$710,000 | S$610,000 |
| Aug 2024 | S$568,000 | S$595,000 |
| Jul 2024 | S$550,000 | S$600,000 |
| Jun 2024 | S$574,944 | S$590,000 |
| May 2024 | S$612,944 | S$580,000 |
| Apr 2024 | S$752,500 | S$569,444 |
| Mar 2024 | S$555,000 | S$570,000 |
| Feb 2024 | S$546,000 | S$570,000 |
| Jan 2024 | S$522,900 | S$565,000 |
| Dec 2023 | S$538,888 | S$564,000 |
| Nov 2023 | S$607,500 | S$560,000 |
| Oct 2023 | S$718,000 | S$558,000 |
| Sep 2023 | S$520,000 | S$555,000 |
| Aug 2023 | S$555,000 | S$559,444 |
| Jul 2023 | S$533,444 | S$550,000 |
| Jun 2023 | S$515,388 | S$545,000 |
| May 2023 | S$530,000 | S$550,000 |
| Apr 2023 | S$517,500 | S$540,000 |
| Mar 2023 | S$628,000 | S$544,400 |
| Feb 2023 | S$545,000 | S$535,000 |
| Jan 2023 | S$735,000 | S$530,000 |
| Dec 2022 | S$684,000 | S$530,000 |
| Nov 2022 | S$515,000 | S$530,000 |
| Oct 2022 | S$509,000 | S$530,000 |
| Sep 2022 | S$530,000 | S$523,888 |
| Aug 2022 | S$475,000 | S$515,000 |
| Jul 2022 | S$525,000 | S$520,000 |
| Jun 2022 | S$505,000 | S$510,000 |
| May 2022 | S$504,000 | S$510,044 |
| Apr 2022 | S$589,000 | S$503,000 |
| Mar 2022 | S$562,000 | S$500,000 |
| Feb 2022 | S$460,000 | S$485,000 |
| Jan 2022 | S$457,500 | S$490,000 |
| Dec 2021 | S$485,500 | S$490,000 |
| Nov 2021 | S$468,000 | S$488,000 |
| Oct 2021 | S$478,000 | S$488,000 |
| Sep 2021 | S$443,500 | S$480,000 |
| Aug 2021 | S$450,000 | S$475,500 |
| Jul 2021 | S$470,000 | S$468,000 |
| Jun 2021 | S$440,000 | S$470,000 |
| May 2021 | S$438,000 | S$470,000 |
| Apr 2021 | S$435,000 | S$460,000 |
| Mar 2021 | S$448,000 | S$455,000 |
| Feb 2021 | S$410,000 | S$448,000 |
| Jan 2021 | S$448,000 | S$448,000 |
| Dec 2020 | S$419,000 | S$440,000 |
| Nov 2020 | S$397,000 | S$430,000 |
| Oct 2020 | S$408,000 | S$436,000 |
| Sep 2020 | S$386,888 | S$420,000 |
| Aug 2020 | S$428,000 | S$418,000 |
| Jul 2020 | S$450,000 | S$410,000 |
| Jun 2020 | S$407,000 | S$409,000 |
| May 2020 | S$380,000 | S$422,000 |
| Apr 2020 | S$572,000 | S$410,000 |
| Mar 2020 | S$410,000 | S$410,000 |
| Feb 2020 | S$408,000 | S$400,000 |
| Jan 2020 | S$383,000 | S$395,000 |
| Dec 2019 | S$400,000 | S$405,000 |
| Nov 2019 | S$405,000 | S$405,000 |
| Oct 2019 | S$384,000 | S$400,000 |
| Sep 2019 | S$419,000 | S$397,000 |
| Aug 2019 | S$410,000 | S$400,000 |
| Jul 2019 | S$385,888 | S$400,000 |
| Jun 2019 | S$415,000 | S$400,000 |
| May 2019 | S$430,000 | S$395,000 |
| Apr 2019 | S$403,000 | S$398,500 |
| Mar 2019 | S$402,500 | S$400,000 |
| Feb 2019 | S$415,000 | S$393,888 |
| Jan 2019 | S$400,000 | S$395,000 |
| Dec 2018 | S$425,000 | S$395,000 |
| Nov 2018 | S$418,000 | S$395,000 |
| Oct 2018 | S$442,000 | S$396,000 |
| Sep 2018 | S$420,000 | S$400,000 |
| Aug 2018 | S$440,500 | S$400,000 |
| Jul 2018 | S$495,000 | S$405,000 |
| Jun 2018 | S$440,000 | S$405,000 |
| May 2018 | S$460,000 | S$400,000 |
| Apr 2018 | S$510,000 | S$405,000 |
| Mar 2018 | S$470,000 | S$410,000 |
| Feb 2018 | S$431,500 | S$400,000 |
| Jan 2018 | S$455,000 | S$410,000 |
| Dec 2017 | S$440,000 | S$405,000 |
| Nov 2017 | S$470,000 | S$407,000 |
| Oct 2017 | S$468,000 | S$400,000 |
| Sep 2017 | S$466,000 | S$410,000 |
| Aug 2017 | S$458,000 | S$414,000 |
| Jul 2017 | S$450,000 | S$400,004 |
| Jun 2017 | S$470,000 | S$408,000 |
| May 2017 | S$470,000 | S$408,000 |
| Apr 2017 | S$445,000 | S$400,000 |
| Mar 2017 | S$472,500 | S$418,000 |
| Feb 2017 | S$472,000 | S$408,000 |
| Jan 2017 | S$437,500 | S$410,000 |
Source: HDB. Data to Oct 2026.
- 3-room: S$430,000, against S$440,000 islandwide.
- 4-room: S$620,000, against S$630,000.
- 5-room: S$981,500, against S$745,000.
- Executive: S$1,201,888, against S$915,500.
The 4-room rent of S$3,400 compares with S$3,350 islandwide. A year of rent divided by the median price is a rough guide only.
It ignores vacancy, costs and loan interest, and the flats behind each median differ.
Why a median can jump
The 5-room median in the window is S$981,500, a change of +8.8% on the 12 months before. That is large for a town with 146 5-room sales. The executive row rests on only 7 sales.
A few high-priced sales can move a median a long way. The mix of blocks sold matters more than any change in price for a flat of the same kind. Read the 4-room and 3-room rows first, where the counts are larger.
For the island trend, use the index, which follows repeat sales of the same flats. HDB’s resale price index fell 0.1% in the Q3 2026 final.
- Policy measures (select one for details)
Latest: HDB 202.5 (Q3 2026), down 0.6% on Q3 2025.
HDB adjusts for the mix of flats sold: it used stratification up to 3Q2014 and a stratified hedonic regression from 4Q2014 (HDB, data.gov.sg). Quarters appear when HDB publishes the final figure.
Table view
| Period | HDB Resale Price Index |
|---|---|
| Q3 2026 | 202.5 |
| Q2 2026 | 202.8 |
| Q1 2026 | 203.4 |
| Q4 2025 | 203.6 |
| Q3 2025 | 203.7 |
| Q2 2025 | 202.9 |
| Q1 2025 | 201.0 |
| Q4 2024 | 197.9 |
| Q3 2024 | 192.9 |
| Q2 2024 | 187.9 |
| Q1 2024 | 183.7 |
| Q4 2023 | 180.4 |
| Q3 2023 | 178.5 |
| Q2 2023 | 176.2 |
| Q1 2023 | 173.6 |
| Q4 2022 | 171.9 |
| Q3 2022 | 168.1 |
| Q2 2022 | 163.9 |
| Q1 2022 | 159.5 |
| Q4 2021 | 155.7 |
| Q3 2021 | 150.6 |
| Q2 2021 | 146.4 |
| Q1 2021 | 142.2 |
| Q4 2020 | 138.1 |
| Q3 2020 | 133.9 |
| Q2 2020 | 131.9 |
| Q1 2020 | 131.5 |
| Q4 2019 | 131.5 |
| Q3 2019 | 130.9 |
| Q2 2019 | 130.8 |
| Q1 2019 | 131.0 |
| Q4 2018 | 131.4 |
| Q3 2018 | 131.6 |
| Q2 2018 | 131.7 |
| Q1 2018 | 131.6 |
| Q4 2017 | 132.6 |
| Q3 2017 | 132.8 |
| Q2 2017 | 133.7 |
| Q1 2017 | 133.9 |
| Q4 2016 | 134.6 |
| Q3 2016 | 134.7 |
| Q2 2016 | 134.7 |
| Q1 2016 | 134.7 |
| Q4 2015 | 134.8 |
| Q3 2015 | 134.6 |
| Q2 2015 | 135.0 |
| Q1 2015 | 135.6 |
Policy measures marked on this chart (11)
- 2025-07-03 Seller's Stamp Duty holding period back to four years, rates raised by 4 pp
- 2024-08-19 HDB loan LTV cut to 75% and Enhanced CPF Housing Grant raised
- 2023-04-26 ABSD rates raised, April 2023
- 2023-02-14 CPF Housing Grant raised for first-time resale buyers, Budget 2023
- 2023-02-14 Buyer's Stamp Duty raised for higher-value properties, Budget 2023
- 2022-09-29 Property measures, September 2022: higher TDSR and MSR rate floor, HDB loan LTV 80%, 15-month wait-out
- 2021-12-15 Property cooling measures, December 2021: higher ABSD, TDSR 55%, HDB loan LTV 85%
- 2018-07-05 Property cooling measures, July 2018: higher ABSD and lower LTV limits
- 2018-02-19 Budget 2018: Proximity Housing Grant enhanced
- 2018-02-19 Budget 2018: top BSD rate raised to 4% above S$1m
- 2017-03-10 SSD holding period cut to 3 years; TDSR relaxed for equity withdrawal
Source: HDB. Data to Q3 2026.
The condos next door
The table lists the busiest condos within about 1.2 km of Ang Mo Kio MRT, with their tenure, sizes sold and recent prices per sq ft. The map shows where each one stands.
| Condo | Street | Tenure | Homes | Unit types | Sizes (sq ft) | Deals | Median psf | Prices |
|---|---|---|---|---|---|---|---|---|
| Centro Residences | Ang Mo Kio Avenue 8 | 99 yrs, 2007 | 329 | 2-4 BR | 743 to 1,561 | 26 | S$2,021 | S$1.52m to S$2.78m |
| Grandeur 8 | Ang Mo Kio Central 3 | 99 yrs, 2002 | 579 | 2 BR (104), 3 BR (356), 4 BR (117) | 1,109 to 1,841 | 17 | S$1,544 | S$1.55m to S$2.25m |
Source: URA. Data to Oct 2026.
Scroll sideways to see the whole map.
- Ang Mo Kio
- Leasehold project
- MRT or LRT station
- Expressway
- Park
- Water
Source: URA, OneMap, LTA, NParks. Roads, rail lines and water © OpenStreetMap contributors.
URA’s list of postal districts places Ang Mo Kio in postal district 20, which it shares with Bishan and Thomson. It is the closest unit we can measure, so it mixes several neighbourhoods.
These medians cover URA’s private resale caveats (non-landed, executive condominiums excluded).
| Quarter | Resale caveats | Median price per sq ft |
|---|---|---|
| Q3 2025 | 113 | S$1,879.7 |
| Q4 2025 | 108 | S$2,009.4 |
| Q1 2026 | 87 | S$1,927.2 |
| Q2 2026 | 101 | S$1,955.3 |
| Q3 2026 | 116 | S$1,950.9 |
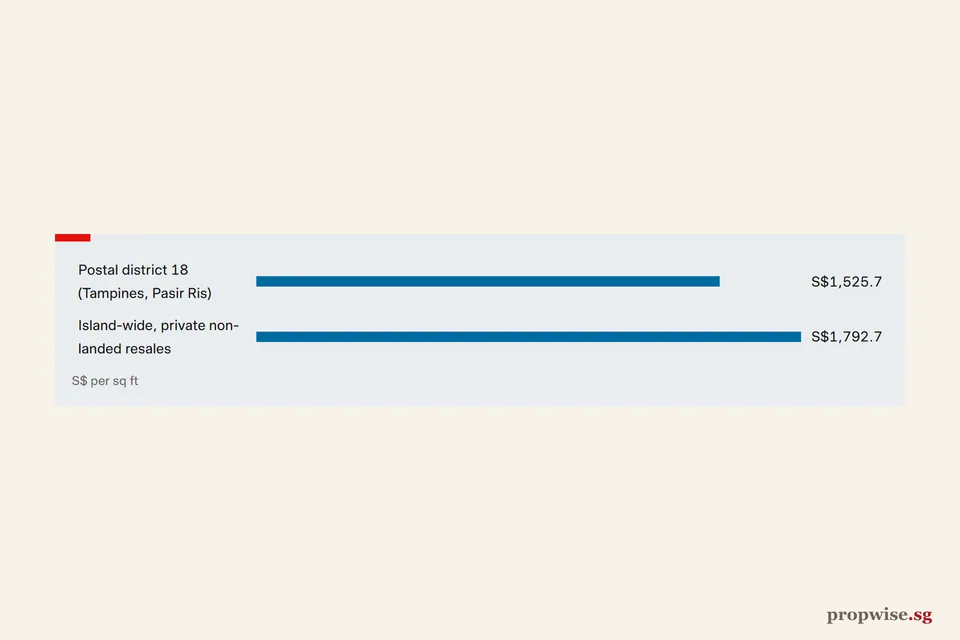
As at Q3 2026, the island-wide median for private non-landed resales was S$1,776.1 per sq ft, so district 20 sat about S$175 above it.
What is new
LTA’s Cross Island Line page, last updated 4 August 2026, lists Ang Mo Kio station (CR11) in Phase 1, as an interchange with the North-South Line. It says Phase 1 is expected to be completed by 2030.
Schematic, not to scale. The red dot marks the station this article is about; large dots are interchanges. Interchange lines: EWL East-West, NEL North-East, NSL North-South, TEL Thomson-East Coast. Source: LTA, Cross Island Line. The 2030 date is a target.
What is behind Ang Mo Kio’s price gaps
The town has cheap 3-room flats, a 4-room median below the island and 5-room flats near S$1 million. Two measured facts explain most of that. Two plans matter less than they may seem.
1. Newly MOP 5-room flats lift one row. MOP is the minimum occupation period, the years an owner must live in a new flat before selling it.
Of 127 Ang Mo Kio 5-room resales in the 12 months to September 2025, 44 sold for S$1 million or more. In the 12 months to September 2026 it was 66 of 135.
Resales of 5-room flats with a 2020 or later lease start went from none to 26. Also, 26 of the 66 million-dollar deals were on Ang Mo Kio Street 23.
EdgeProp (24 July 2026) quotes PropNex’s Wong Siew Ying on 364 newly MOP flats in eight towns, Ang Mo Kio among them. Of those, 87 sold for S$1 million or more in Q2 2026. EdgeProp’s table, from ERA data, shows 38 million-dollar deals in Ang Mo Kio in the quarter.
So the +8.8% change in the 5-room median on the 12 months before says more about which flats sold than about older flats gaining value.
2. An old town. HDB’s property information file puts 82.8% of the flats HDB lists as sold in Ang Mo Kio at completion before 1990.
Of the town’s 866 resales in the 12 months to September 2026, 632 (73.0%) had a lease start in the 1970s or 1980s, and 421 were 3-room flats. Lease age holds down the 3-room and 4-room medians, whose changes were small: the 3-room median changed by −2.0% on the 12 months before.
Rent also looks steady: the 4-room rent changed by 0.0% on the 12 months before.
3. Plans (target, not yet in the numbers). LTA says Cross Island Line Phase 1, with an Ang Mo Kio interchange, should finish by 2030.
EdgeProp reported that HDB chose Blocks 562 to 565 on Ang Mo Kio Avenue 3 (606 flats) for SERS in April 2022. Replacement flats at Ang Mo Kio Drive are due by 3Q2027. SERS is the Selective En bloc Redevelopment Scheme.
4. New BTO flats (no effect yet). ERA lists Kebun Baru Breeze and Kebun Baru Ridge, both Plus projects, in HDB’s June 2026 BTO exercise (17 June 2026). New flats take years to build and cannot be resold before their MOP.
They may matter to buyers who now weigh a BTO against a resale flat.