Bishan HDB Resale Prices, Rents and Condos: Area Guide (2026)
Bishan area guide for 2026: MRT lines, schools, HDB resale and rent medians, the condo market, a URA land bid and a buyer checklist.
Bishan is a Rest of Central Region (RCR) estate with three MRT lines, a large school cluster and a mix of HDB flats, condos and landed homes. The 2017 version of this guide picked three condos using prices that are long out of date, so those numbers are gone. This guide uses current data from URA, LTA, MOE and data.gov.sg.
At a glance
- Bishan is in the RCR. URA’s RCR price index fell 1.2% in Q2 2026 and was flat 0.0% in the Q3 2026 final.
- About 64% of residents live in HDB flats, 23% in condos and other private apartments, and 12% in landed homes.
- Bishan has an NSL/CCL interchange, and TEL stations at Bright Hill and Upper Thomson. Bright Hill will join the Cross Island Line (CRL) by 2030.
- HDB resale medians (Nov 2025–Oct 2026): 3-room S$530,000, 4-room S$788,000, 5-room S$970,000.
- URA sold the Lorong Puntong / Sin Ming Avenue site on 18 Sep 2026 at S$17,350.26 per sqm of GFA.
The estate in numbers
SingStat’s 2025 survey counts 87,530 residents in Bishan. Of these, 56,280 live in HDB flats, 20,280 in condos and other apartments, and 10,220 in landed homes. About 23% are aged 65 or older (SingStat’s age table). Bishan has more landed homes than Queenstown or Geylang, so the estate is less flat-heavy.
Residents
Source: SingStat, Population Trends 2025 (C020125) (2025).
URA’s segment definitions put the Core Central Region (CCR) at postal districts 9, 10 and 11, the Downtown Core and Sentosa. Bishan sits outside them, so it is RCR. The RCR guide compares the segments.
MRT, roads and schools
Bishan station (NS17/CC15) joins the North-South and Circle lines. Marymount (CC16) is on the Circle Line. On the Thomson-East Coast Line, Bright Hill (TE7) and Upper Thomson (TE8) opened on 28 August 2021. We counted stations by matching LTA exit locations to URA’s planning-area boundary.
LTA says the Cross Island Line Phase 1, with 12 stations from CR2 to Bright Hill (CR13), should be complete by 2030. Bright Hill becomes an interchange with the TEL. LTA says the line will also give public transport access to Bishan-Ang Mo Kio Park.
North-South Line
- Bishan NS17Circle Line (CC15)Interchange
Circle Line
- Bishan CC15North-South Line (NS17)Interchange
- Marymount CC16
Thomson-East Coast Line
- Bright Hill TE7Cross Island Line (CR13), Phase 1, by 2030Opened 28 August 2021
- Upper Thomson TE8Opened 28 August 2021
Source: LTA, Thomson-East Coast Line (October 2026); LTA, Cross Island Line. Schematic, not to scale. Only the stations the article names are shown. Station codes as in the article.
MOE’s school directory lists nine schools in its Bishan zone. For primary, there are Ai Tong, Kuo Chuan Presbyterian and Catholic High (a P1–S4 school). For secondary, there are Guangyang, Kuo Chuan Presbyterian, Peirce and Whitley. There are also Raffles Institution and Eunoia Junior College. For Primary 1, MOE ranks applicants by home-to-school distance in bands of 1 km and 2 km. Confirm the distance with MOE, and read each school’s own admission rules.
| School | Level | Type | MRT listed by MOE | Address |
|---|---|---|---|---|
| Ai Tong School | Primary | Government-aided | Bishan | 100 Bright Hill Drive |
| Kuo Chuan Presbyterian Primary School | Primary | Government-aided | Bishan | 8 Bishan Street 13 |
| Catholic High School | Mixed (P1-S4) | Government-aided, autonomous, boys' school | Bishan | 9 Bishan Street 22 |
| Guangyang Secondary School | Secondary (S1-S5) | Government | Bishan | 8 Bishan Street 12 |
| Kuo Chuan Presbyterian Secondary School | Secondary (S1-S5) | Government-aided | Bishan | 10 Bishan Street 13 |
| Peirce Secondary School | Secondary (S1-S5) | Government | Ang Mo Kio, Bishan, Marymount, Bright Hill | 10 Sin Ming Walk |
| Whitley Secondary School | Secondary (S1-S5) | Government | Bishan, Marymount | 30 Bishan Street 24 |
| Raffles Institution | Mixed (S1-JC2), integrated programme | Independent | Bishan, Marymount | 1 Raffles Institution Lane |
| Eunoia Junior College | Junior college | Government, integrated programme | Bishan, Marymount, Ang Mo Kio, Bright Hill | 2 Sin Ming Place |
Source: MOE school directory (data.gov.sg) (12 October 2026). For Primary 1, MOE ranks applicants by home-to-school distance in bands of 1 km and 2 km. Check the distance with MOE.
HDB resale and rent benchmarks
| Bishan | Resales | Median price | Change | Rentals | Median rent | Change |
|---|---|---|---|---|---|---|
| 3-room | 64 | S$530,000 | −2.5% | 169 | S$3,000 | +3.5% |
| 4-room | 200 | S$788,000 | +0.5% | 380 | S$3,650 | +1.4% |
| 5-room | 122 | S$970,000 | −3.4% | 169 | S$4,000 | 0.0% |
| Executive | 52 | S$1,292,500 | +2.6% | 30 | S$4,500 | 0.0% |
Of Bishan’s 439 resales, 98 (24%) were S$1m or more, against 7% islandwide. Most are 5-room and executive flats on Bishan Streets 12, 13, 22, 23 and 24. The 4-room median was S$780,000 in the previous 12 months, so it is little changed. Bishan’s flats are mostly mid-age: 178 of the 200 4-room sales had leases that started in 1980–1999 (median S$785,000).
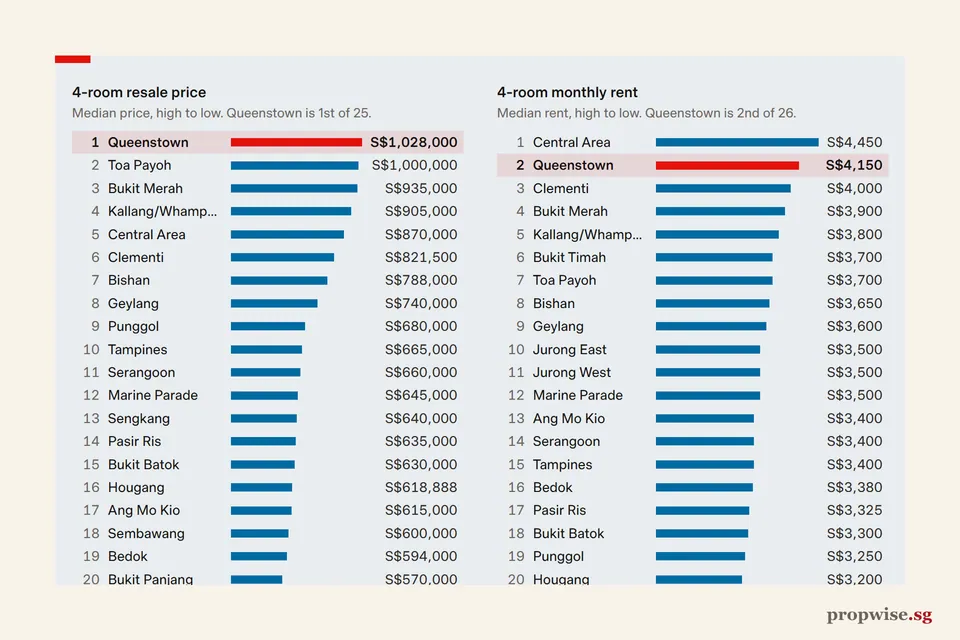
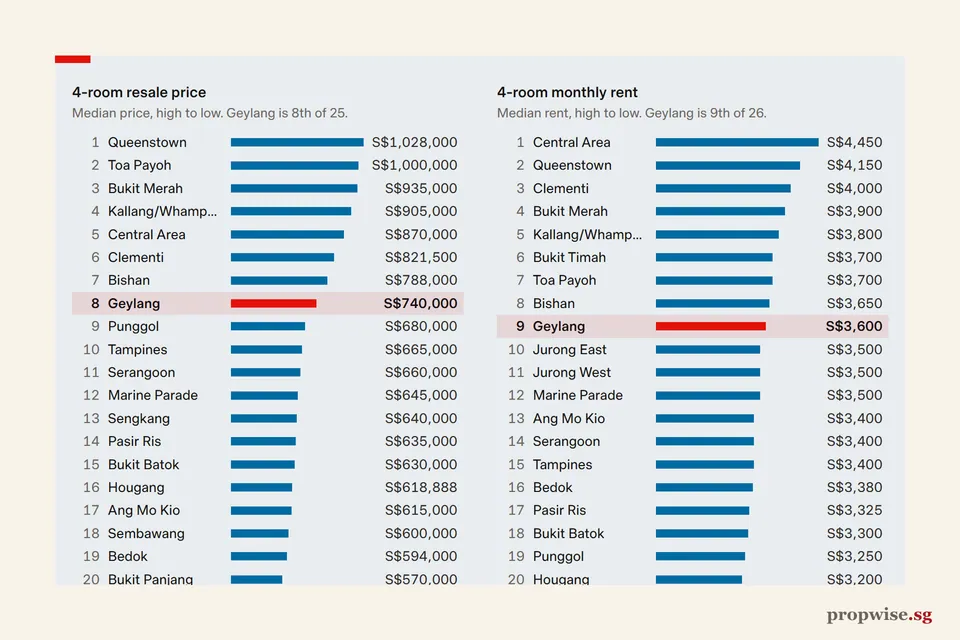
How Bishan compares with every other HDB town:
4-room resale price
Median price, high to low. Bishan is 7th of 25.
- 1QueenstownS$1,030,000
- 2Toa PayohS$1,000,888
- 3Bukit MerahS$938,000
- 4Kallang/WhampoaS$900,000
- 5Central AreaS$870,000
- 6ClementiS$801,500
- 7BishanS$788,000
- 8GeylangS$740,000
- 9PunggolS$680,000
- 10TampinesS$665,500
- 11SerangoonS$653,444
- 12SengkangS$640,000
- 13Marine ParadeS$637,500
- 14Pasir RisS$635,000
- 15Bukit BatokS$625,000
- 16Ang Mo KioS$620,000
- 17HougangS$618,888
- 18BedokS$600,000
- 19SembawangS$600,000
- 20Bukit PanjangS$570,000
- 21Choa Chu KangS$551,944
- 22YishunS$550,000
- 23Jurong EastS$549,444
- 24WoodlandsS$548,000
- 25Jurong WestS$534,500
Island median: S$630,000
Not ranked (fewer than 30 cases): Bukit Timah.
4-room monthly rent
Median rent, high to low. Bishan is 8th of 26.
- 1Central AreaS$4,400
- 2QueenstownS$4,200
- 3ClementiS$4,000
- 4Bukit MerahS$3,950
- 5Kallang/WhampoaS$3,800
- 6Toa PayohS$3,700
- 7Bukit TimahS$3,675
- 8BishanS$3,650
- 9GeylangS$3,650
- 10Jurong EastS$3,500
- 11Jurong WestS$3,500
- 12Marine ParadeS$3,500
- 13TampinesS$3,420
- 14Ang Mo KioS$3,400
- 15BedokS$3,400
- 16SerangoonS$3,400
- 17Pasir RisS$3,350
- 18Bukit BatokS$3,300
- 19PunggolS$3,250
- 20HougangS$3,200
- 21SengkangS$3,200
- 22Choa Chu KangS$3,100
- 23SembawangS$3,100
- 24WoodlandsS$3,100
- 25YishunS$3,100
- 26Bukit PanjangS$3,000
Island median: S$3,350
Twelve months to October 2026. Bars start above zero so that gaps show; compare the figures, not the bar lengths. Medians of HDB resale registrations and renting-out approvals, calculated by Propwise from HDB data on data.gov.sg. Rents are declared by owners and not verified by HDB.
The condo market here
The table lists the busiest condos within about 1.3 km of Bishan MRT, with their tenure, sizes sold and recent prices per sq ft. The map shows where each one stands.
| Condo | Street | Tenure | Homes | Unit types | Sizes (sq ft) | Deals | Median psf | Prices |
|---|---|---|---|---|---|---|---|---|
| Sky Vue | Bishan Street 15 | 99 yrs, 2013 | 694 | 1-3 BR, PH | 484 to 1,141 | 21 | S$2,227 | S$1.02m to S$2.90m |
| Sky Habitat | Bishan Street 15 | 99 yrs, 2011 | 509 | 1-4 BR, PH | 710 to 3,477 | 10 | S$2,044 | S$1.42m to S$3.69m |
| Rafflesia Condominium | Bishan Street 21 | 99 yrs, 1997 | 230 | 2, 3 BR | 915 to 1,324 | 7 | S$1,653 | S$1.40m to S$2.20m |
| Seasons View | Pemimpin Drive | 99 yrs, 1996 | 224 | 2, 3, 4 BR | 969 to 2,745 | 11 | S$1,529 | S$1.35m to S$1.90m |
Source: URA. Data to Nov 2026.
Scroll sideways to see the whole map.
- Bishan
- Leasehold project
- MRT or LRT station
- Expressway
- Park
- Water
Source: URA, OneMap, LTA, NParks. Roads, rail lines and water © OpenStreetMap contributors.
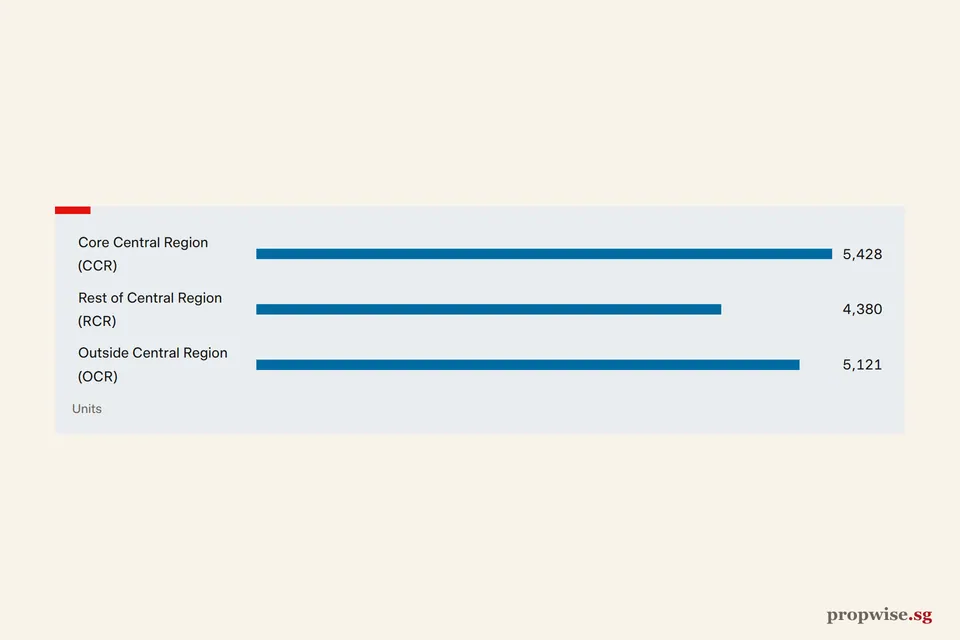
About 7,300 of Bishan’s 30,100 households live in condos and other apartments, and 2,900 in landed homes (SingStat). Private data are thinner than HDB data, so use URA’s segment figures. RCR prices moved +0.8% in Q1, −1.2% in Q2 and 0.0% in the Q3 2026 final. At end-Q2 there were 4,380 unsold units in uncompleted RCR projects.
- Core Central Region
- Rest of Central Region
- Outside Central Region
- Policy measures (select one for details)
Latest: CCR 162.0 (Q3 2026), down 0.9% on Q3 2025; RCR 226.2 (Q3 2026), up 0.3% on Q3 2025; OCR 277.3 (Q3 2026), up 5.4% on Q3 2025.
Table view
| Period | Core Central Region | Rest of Central Region | Outside Central Region |
|---|---|---|---|
| Q3 2026 | 162.0 | 226.2 | 277.3 |
| Q2 2026 | 161.5 | 226.2 | 271.1 |
| Q1 2026 | 158.6 | 228.9 | 271.4 |
| Q4 2025 | 157.7 | 227.1 | 265.6 |
| Q3 2025 | 163.4 | 225.5 | 263.0 |
| Q2 2025 | 160.7 | 224.8 | 260.9 |
| Q1 2025 | 156.0 | 227.3 | 258.1 |
| Q4 2024 | 154.8 | 223.5 | 257.3 |
| Q3 2024 | 150.9 | 217.0 | 249.1 |
| Q2 2024 | 152.6 | 215.3 | 249.1 |
| Q1 2024 | 153.1 | 211.9 | 248.6 |
| Q4 2023 | 148.1 | 211.3 | 248.1 |
| Q3 2023 | 142.5 | 213.0 | 237.4 |
| Q2 2023 | 146.5 | 208.6 | 225.0 |
| Q1 2023 | 146.6 | 213.9 | 222.3 |
| Q4 2022 | 145.4 | 204.9 | 218.2 |
| Q3 2022 | 144.4 | 198.7 | 224.0 |
| Q2 2022 | 141.2 | 193.3 | 208.4 |
| Q1 2022 | 138.6 | 181.7 | 204.1 |
| Q4 2021 | 138.7 | 186.7 | 199.7 |
| Q3 2021 | 135.1 | 175.0 | 188.9 |
| Q2 2021 | 135.8 | 170.6 | 189.1 |
| Q1 2021 | 134.3 | 170.4 | 185.6 |
| Q4 2020 | 133.6 | 160.6 | 183.6 |
| Q3 2020 | 129.5 | 153.8 | 180.4 |
| Q2 2020 | 134.6 | 150.0 | 177.4 |
| Q1 2020 | 131.1 | 152.6 | 177.2 |
| Q4 2019 | 134.1 | 153.4 | 177.9 |
| Q3 2019 | 138.0 | 155.4 | 173.1 |
| Q2 2019 | 135.3 | 153.4 | 171.7 |
| Q1 2019 | 132.3 | 148.2 | 171.0 |
| Q4 2018 | 136.4 | 149.2 | 170.7 |
| Q3 2018 | 137.8 | 146.6 | 169.5 |
| Q2 2018 | 136.0 | 148.5 | 169.7 |
| Q1 2018 | 134.8 | 140.6 | 164.8 |
| Q4 2017 | 127.8 | 138.9 | 156.1 |
| Q3 2017 | 126.0 | 138.3 | 154.9 |
| Q2 2017 | 125.9 | 137.6 | 153.7 |
| Q1 2017 | 126.5 | 136.8 | 154.2 |
| Q4 2016 | 127.0 | 136.4 | 154.0 |
| Q3 2016 | 126.9 | 139.2 | 154.9 |
| Q2 2016 | 129.4 | 140.6 | 156.5 |
| Q1 2016 | 129.0 | 140.3 | 157.3 |
| Q4 2015 | 128.6 | 140.3 | 159.4 |
| Q3 2015 | 129.0 | 140.9 | 159.4 |
| Q2 2015 | 130.6 | 143.2 | 162.0 |
| Q1 2015 | 131.4 | 144.1 | 163.8 |
| Q4 2014 | 131.9 | 146.6 | 165.6 |
| Q3 2014 | 133.1 | 148.6 | 167.0 |
| Q2 2014 | 134.2 | 149.2 | 167.6 |
| Q1 2014 | 136.2 | 149.7 | 169.1 |
| Q4 2013 | 137.6 | 154.8 | 169.3 |
| Q3 2013 | 140.5 | 154.2 | 170.9 |
| Q2 2013 | 140.9 | 155.6 | 167.3 |
| Q1 2013 | 141.2 | 155.3 | 161.1 |
| Q4 2012 | 140.3 | 155.0 | 158.9 |
| Q3 2012 | 139.4 | 153.6 | 153.2 |
| Q2 2012 | 139.2 | 152.3 | 151.6 |
| Q1 2012 | 138.4 | 151.7 | 150.9 |
| Q4 2011 | 139.2 | 152.5 | 149.2 |
| Q3 2011 | 138.5 | 152.4 | 148.4 |
| Q2 2011 | 137.5 | 150.6 | 145.3 |
| Q1 2011 | 135.3 | 148.9 | 142.8 |
| Q4 2010 | 133.9 | 145.9 | 138.6 |
| Q3 2010 | 131.0 | 143.3 | 135.8 |
| Q2 2010 | 128.9 | 140.0 | 132.9 |
| Q1 2010 | 122.4 | 133.8 | 125.7 |
| Q4 2009 | 117.2 | 124.1 | 120.5 |
| Q3 2009 | 109.2 | 113.3 | 113.4 |
| Q2 2009 | 94.8 | 95.6 | 97.7 |
| Q1 2009 | 100.0 | 100.0 | 100.0 |
| Q4 2008 | 119.4 | 120.4 | 107.9 |
| Q3 2008 | 127.6 | 128.3 | 114.6 |
| Q2 2008 | 131.2 | 131.5 | 116.3 |
| Q1 2008 | 131.3 | 130.6 | 115.2 |
| Q4 2007 | 126.5 | 126.4 | 111.0 |
| Q3 2007 | 117.7 | 117.4 | 103.7 |
| Q2 2007 | 108.6 | 108.7 | 96.1 |
| Q1 2007 | 100.7 | 100.6 | 89.7 |
| Q4 2006 | 95.4 | 96.9 | 87.9 |
| Q3 2006 | 90.9 | 94.8 | 86.5 |
| Q2 2006 | 86.3 | 94.4 | 85.8 |
| Q1 2006 | 82.5 | 94.4 | 84.5 |
| Q4 2005 | 81.5 | 94.1 | 84.3 |
| Q3 2005 | 79.7 | 94.1 | 83.6 |
| Q2 2005 | 77.9 | 94.1 | 83.6 |
| Q1 2005 | 77.6 | 93.7 | 83.6 |
| Q4 2004 | 76.9 | 92.9 | 83.4 |
| Q3 2004 | 76.4 | 92.2 | 83.0 |
| Q2 2004 | 76.1 | 91.6 | 82.7 |
| Q1 2004 | 76.0 | 91.5 | 83.0 |
Policy measures marked on this chart (22)
- 2025-07-03 Seller's Stamp Duty holding period back to four years, rates raised by 4 pp
- 2024-08-19 HDB loan LTV cut to 75% and Enhanced CPF Housing Grant raised
- 2023-04-26 ABSD rates raised, April 2023
- 2023-02-14 CPF Housing Grant raised for first-time resale buyers, Budget 2023
- 2023-02-14 Buyer's Stamp Duty raised for higher-value properties, Budget 2023
- 2022-09-29 Property measures, September 2022: higher TDSR and MSR rate floor, HDB loan LTV 80%, 15-month wait-out
- 2021-12-15 Property cooling measures, December 2021: higher ABSD, TDSR 55%, HDB loan LTV 85%
- 2018-07-05 Property cooling measures, July 2018: higher ABSD and lower LTV limits
- 2018-02-19 Budget 2018: Proximity Housing Grant enhanced
- 2018-02-19 Budget 2018: top BSD rate raised to 4% above S$1m
- 2017-03-10 SSD holding period cut to 3 years; TDSR relaxed for equity withdrawal
- 2013-08-27 HDB loan and resale measures, August 2013
- 2013-06-28 MAS introduces the Total Debt Servicing Ratio (TDSR) framework
- 2013-01-11 Property cooling measures, January 2013
- 2012-10-05 Maximum loan tenure of 35 years and tighter LTV limits, October 2012
- 2011-12-07 Additional Buyer's Stamp Duty introduced, December 2011
- 2011-01-13 Property cooling measures, January 2011
- 2010-08-30 HDB measures after National Day Rally 2010: DBSS income ceiling, 5-year MOP for non-subsidised flats
- 2010-08-30 Property cooling measures, August 2010
- 2010-02-19 Seller's Stamp Duty introduced and LTV limit cut to 80%, February 2010
- 2009-09-14 Interest-only loans and Interest Absorption Scheme disallowed, September 2009
- 2005-07-19 Property policy review, July 2005: LTV limit raised to 90%, CPF housing rules eased, foreign ownership rules eased
Source: URA. Data to Q3 2026.
Land bids show what developers will pay. URA awarded Lorong Puntong / Sin Ming Avenue on 18 September 2026 for S$208.1m on a maximum 11,994 sqm of GFA. That is S$17,350.26 per sqm, about S$1,612 per sq ft, before construction and profit. Seven bids ranged from S$13,519.26 to S$17,350.26. The top bid was about 11% above the second.
- Price
- S$208.1m
- Maximum GFA
- 11,994 sqm
- Per sqm of GFA
- S$17,350.26
- Per sq ft (about)
- S$1,612
- Number of bids
- 7
- Lowest
- S$13,519.26 per sqm
- Highest
- S$17,350.26 per sqm
- Top bid above the second
- about 11%
Source: URA, award of Lorong Puntong / Sin Ming Avenue (18 September 2026); URA, tender bids.
Look up any project’s sales on URA’s Property Market Information search. Banks cap debt at 55% of income and test loans at 4%. Packages sit near 1.5–1.8% floating and 2.0–2.2% fixed after the Fed’s 16 September hike. Run your own numbers in the Propwise mortgage calculator.
What is coming
Master Plan 2025 plans to rejuvenate Bishan Town Centre as a sub-regional centre, with a polyclinic, more shops and restaurants, and pedestrian-friendly streets. Agencies are studying a new hawker centre with a revamped bus interchange, and some agencies are exploring moving offices there. URA gives no dates. A pedestrian and cycling bridge over the PIE, part of the Bishan-to-City Links, was due by the second half of 2027 as at June 2025.
Who it suits, and a checklist
Bishan may suit buyers who want a central location with school choice, three MRT lines and a town centre with jobs planned. It may suit less well if you want the cheapest HDB entry price among RCR towns. See what makes a good location.
- Confirm the postal district, so you know if the project is RCR.
- Check the tenure and remaining lease. See valuing leasehold property.
- Time the walk to Bishan, Marymount, Bright Hill or Upper Thomson.
- Check school distance with MOE if you have a child under 7.
- Compare the project’s recent sales on URA’s search.
- Stress-test your loan at 4%.
Bottom line
Bishan is a settled, well-connected RCR estate with a steady HDB market and a town centre plan. The data say prices are stable, not surging. Compare projects on recent sales, tenure and walk time.