Geylang HDB Resale Prices and Shoebox Condos: Area Guide (2026)
Geylang area guide for 2026: MRT lines, schools, HDB resale and rent medians, shoebox condo rules, RCR price data and a buyer checklist.
Geylang is a Rest of Central Region (RCR) estate with older HDB flats, three MRT lines and a mix of homes, food streets and small businesses. The 2018 version of this guide compared shoebox condos using 2018 prices, which no longer apply. This guide uses current official data and explains the rules that shape small units.
At a glance
- Geylang is in the RCR. URA’s RCR price index fell 1.2% in Q2 2026 and was flat 0.0% in the Q3 2026 final.
- About 71% of residents live in HDB flats and about 22% in condos and other private apartments.
- Eight MRT stations on the East-West, Circle and Downtown lines have exits in the planning area.
- HDB resale medians (Nov 2025–Oct 2026): 3-room S$380,000, 4-room S$740,000, 5-room S$925,444. Only 9% of resales reached S$1m.
- URA’s guideline sets a floor of 35 sqm of internal area for every new private flat or condo unit.
The estate in numbers
SingStat’s 2025 survey counts 117,640 residents in Geylang. Of these, 83,770 live in HDB flats, 25,380 in condos and other apartments, and 6,090 in landed homes. About 22% are aged 65 or older (SingStat’s age table).
Residents
Source: SingStat, Population Trends: residents by planning area and type of dwelling (2025 survey).
Leases in the resale data start between 1967 and 2020, with a median start year of 1983. That makes Geylang older than Queenstown (median 2008). Geylang mixes homes with food, industrial and entertainment uses. The mix changes from lorong to lorong, so judge each address on its own.
URA’s segment definitions put Geylang in the Rest of Central Region (RCR), outside postal districts 9, 10 and 11. The RCR guide explains the segment.
MRT, roads and schools
We matched LTA exit locations to URA’s planning-area boundary. Eight stations have exits in Geylang: Eunos (EW7), Paya Lebar (EW8/CC9), Aljunied (EW9), Mountbatten (CC7), Dakota (CC8), MacPherson (CC10/DT26), Mattar (DT25) and Ubi (DT27). Paya Lebar and MacPherson are interchanges. LTA’s pages for the Thomson-East Coast Line, Cross Island Line and other new lines show no new Geylang station that we could find, and Master Plan 2025’s rail station layer shows no planned station in Geylang beyond the existing ones.
East-West Line
- Eunos EW7Haig Girls' and Maha Bodhi list this station
- Paya Lebar EW8Circle Line (CC9)Interchange
- Aljunied EW9Geylang Methodist (Primary and Secondary) list this station
Circle Line
- Mountbatten CC7
- Dakota CC8Broadrick, Haig Girls' and Kong Hwa list this station
- Paya Lebar CC9East-West Line (EW8)Interchange
- MacPherson CC10Downtown Line (DT26)Interchange
Downtown Line
- Mattar DT25Canossa Catholic Primary lists this station
- MacPherson DT26Circle Line (CC10)Interchange
- Ubi DT27Manjusri Secondary and Maha Bodhi list this station
Source: LTA MRT station exits (data.gov.sg) (October 2026); URA planning-area boundary; MOE school directory (data.gov.sg). Schematic, not to scale. Only stations with exits inside the planning area are shown, so the lines continue beyond them.
MOE’s school directory lists eight schools in its Geylang zone. The primary schools are Canossa Catholic, Geylang Methodist, Haig Girls’, Kong Hwa and Maha Bodhi. The secondary schools are Broadrick, Geylang Methodist and Manjusri. For Primary 1, MOE ranks applicants by home-to-school distance, so confirm the distance with MOE before you buy.
| School | Level | Type | MRT listed by MOE | Address |
|---|---|---|---|---|
| Canossa Catholic Primary School | Primary | Government-aided | Mattar | 1 Sallim Road |
| Geylang Methodist School (Primary) | Primary | Government-aided | Aljunied | 4 Geylang East Central |
| Haig Girls' School | Primary (girls) | Government | Eunos, Dakota | 51 Koon Seng Road |
| Kong Hwa School | Primary | Government-aided, SAP | Dakota | 350 Guillemard Road |
| Maha Bodhi School | Primary | Government-aided, SAP | Eunos, Ubi | 10 Ubi Avenue 1 |
| Broadrick Secondary School | Secondary (S1-S5) | Government | Dakota | 61 Dakota Crescent |
| Geylang Methodist School (Secondary) | Secondary (S1-S5) | Government-aided | Aljunied | 2 Geylang East Central |
| Manjusri Secondary School | Secondary (S1-S5) | Government-aided | Ubi | 20 Ubi Avenue 1 |
Source: MOE school directory (data.gov.sg) (October 2026). For Primary 1, MOE ranks applicants by home-to-school distance; check the distance with MOE.
HDB resale and rent benchmarks
| Geylang | Resales | Median price | Change | Rentals | Median rent | Change |
|---|---|---|---|---|---|---|
| 2-room | 20* | S$286,500 | −3.9% | 30 | S$2,100 | −4.5% |
| 3-room | 324 | S$380,000 | +1.3% | 564 | S$2,850 | +1.8% |
| 4-room | 230 | S$740,000 | −6.8% | 325 | S$3,650 | +4.3% |
| 5-room | 74 | S$925,444 | +16.9% | 97 | S$4,000 | 0.0% |
| Executive | 14* | S$1,062,500 | +0.7% | 24* | S$4,300 | +10.3% |
Islandwide medians were S$440,000 (3-room), S$630,000 (4-room) and S$745,000 (5-room). Of Geylang’s 662 resales, 61 were S$1m or more, and 24 of those were on Circuit Road in flats with leases from 2016 and 2020.
Medians shift with the flats that happen to sell. Geylang’s 4-room median was S$802,044 in the previous 12 months, against S$740,000 now. In the latest year, 59 of 230 4-room sales were in flats with leases from 2010 onwards (median S$990,888). Compare like with like.
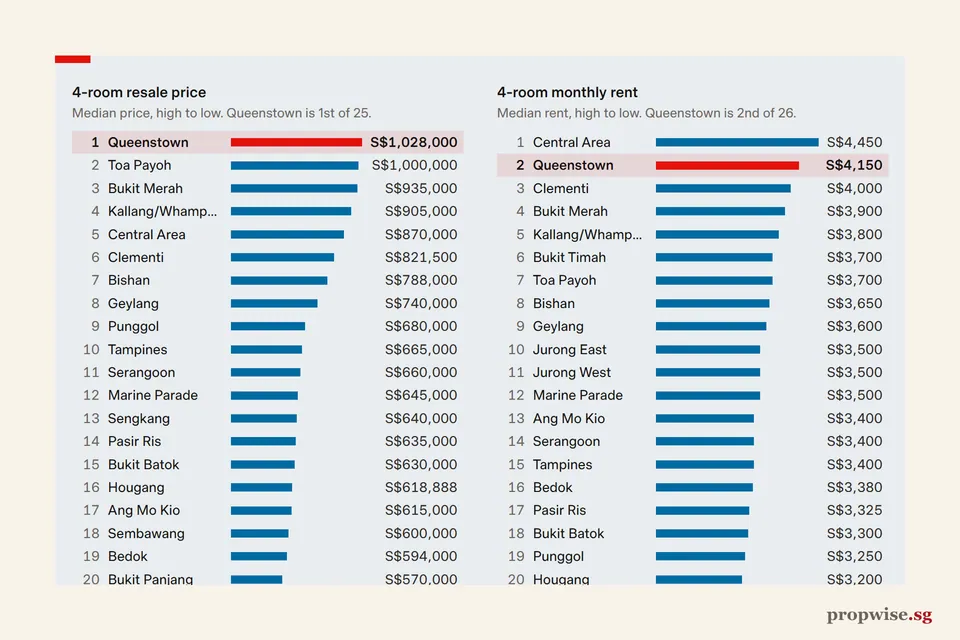
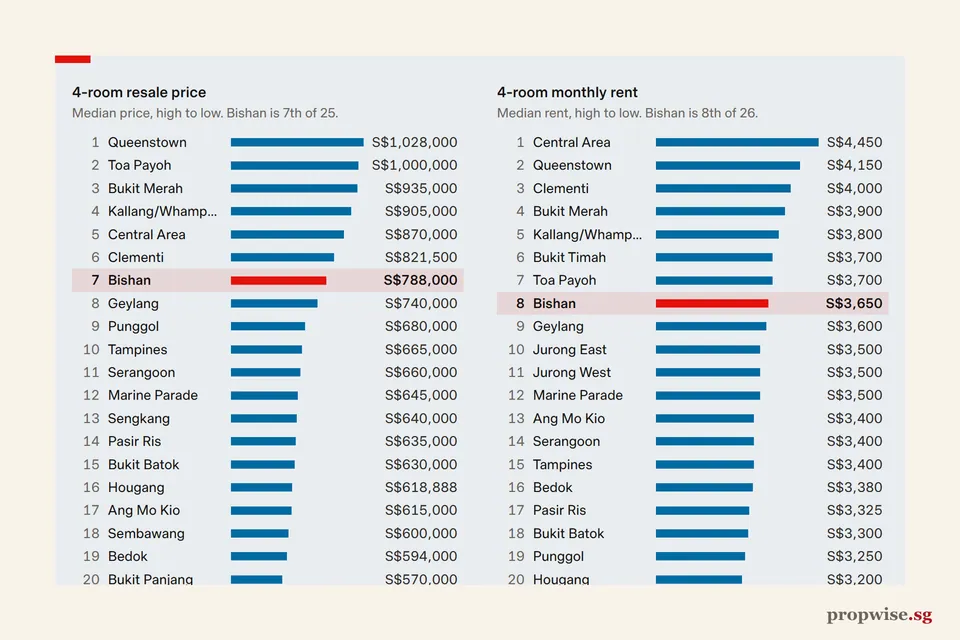
How Geylang compares with every other HDB town:
4-room resale price
Median price, high to low. Geylang is 8th of 25.
- 1QueenstownS$1,030,000
- 2Toa PayohS$1,000,888
- 3Bukit MerahS$938,000
- 4Kallang/WhampoaS$900,000
- 5Central AreaS$870,000
- 6ClementiS$801,500
- 7BishanS$788,000
- 8GeylangS$740,000
- 9PunggolS$680,000
- 10TampinesS$665,500
- 11SerangoonS$653,444
- 12SengkangS$640,000
- 13Marine ParadeS$637,500
- 14Pasir RisS$635,000
- 15Bukit BatokS$625,000
- 16Ang Mo KioS$620,000
- 17HougangS$618,888
- 18BedokS$600,000
- 19SembawangS$600,000
- 20Bukit PanjangS$570,000
- 21Choa Chu KangS$551,944
- 22YishunS$550,000
- 23Jurong EastS$549,444
- 24WoodlandsS$548,000
- 25Jurong WestS$534,500
Island median: S$630,000
Not ranked (fewer than 30 cases): Bukit Timah.
4-room monthly rent
Median rent, high to low. Geylang is 9th of 26.
- 1Central AreaS$4,400
- 2QueenstownS$4,200
- 3ClementiS$4,000
- 4Bukit MerahS$3,950
- 5Kallang/WhampoaS$3,800
- 6Toa PayohS$3,700
- 7Bukit TimahS$3,675
- 8BishanS$3,650
- 9GeylangS$3,650
- 10Jurong EastS$3,500
- 11Jurong WestS$3,500
- 12Marine ParadeS$3,500
- 13TampinesS$3,420
- 14Ang Mo KioS$3,400
- 15BedokS$3,400
- 16SerangoonS$3,400
- 17Pasir RisS$3,350
- 18Bukit BatokS$3,300
- 19PunggolS$3,250
- 20HougangS$3,200
- 21SengkangS$3,200
- 22Choa Chu KangS$3,100
- 23SembawangS$3,100
- 24WoodlandsS$3,100
- 25YishunS$3,100
- 26Bukit PanjangS$3,000
Island median: S$3,350
Twelve months to October 2026. Bars start above zero so that gaps show; compare the figures, not the bar lengths. Medians of HDB resale registrations and renting-out approvals, calculated by Propwise from HDB data on data.gov.sg. Rents are declared by owners and not verified by HDB.
Condos and shoebox units here
The table lists the busiest condos within about 1.2 km of Geylang Road at Aljunied, with their tenure, sizes sold and recent prices per sq ft. Small sizes in the table are the shoebox units. The map shows where each condo stands.
| Condo | Street | Tenure | Homes | Unit types | Sizes (sq ft) | Deals | Median psf | Prices |
|---|---|---|---|---|---|---|---|---|
| Tre Residences | Geylang East Avenue 1 | 99 yrs, 2014 | 250 | 1-3 BR, dual-key, PH | 420 to 947 | 12 | S$1,892 | S$0.97m to S$1.82m |
| Simsville | Geylang East Avenue 2 | 99 yrs, 1994 | 522 | 2, 3, 4 BR | 969 to 1,528 | 20 | S$1,477 | S$1.33m to S$2.42m |
| Rezi 35 | Lorong 35 Geylang | Freehold | – | – | 441 to 1,647 | 5 | S$1,626 | S$0.77m to S$2.55m |
| Central Grove | Geylang East Avenue 1 | 99 yrs, 1997 | 262 | 2 BR (29), 3 BR (234) | 1,023 to 1,410 | 10 | S$1,379 | S$1.50m to S$1.85m |
| The Alcove | Lorong 27 Geylang | 99 yrs, 2000 | 102 | 2, 3 BR | 1,066 to 2,583 | 7 | S$1,140 | S$1.28m to S$2.08m |
| Sims Urban Oasis | Sims Drive | 99 yrs, 2014 | 1,024 | 1-5 BR | 409 to 2,034 | 61 | S$1,903 | S$0.78m to S$2.64m |
| Park Place Residences at Plq | Paya Lebar Road | 99 yrs, 2015 | 429 | 1-3 BR | 484 to 1,367 | 20 | S$2,306 | S$1.06m to S$2.75m |
| The Waterina | Lorong 40 Geylang | Freehold | 398 | 1 BR (54), 2 BR (98), 3 BR (216), 4 BR (28) | 635 to 2,142 | 8 | S$1,997 | S$1.25m to S$3.70m |
| The Antares | Mattar Road | 99 yrs, 2018 | 265 | 1-4 BR, PH | 452 to 1,367 | 16 | S$2,033 | S$1.17m to S$1.62m |
| Guillemard Suites | Guillemard Road | Freehold | 146 | 1-3 BR | 398 to 1,270 | 9 | S$1,519 | S$0.72m to S$1.70m |
| Le Regal | Geylang Road | Freehold | 88 | 1, 2 BR | 366 to 990 | 6 | S$1,444 | S$0.57m to S$1.03m |
| Butterworth 8 | Butterworth Lane | Freehold | 216 | 2, 3, 4 BR | 1,023 to 1,776 | 8 | S$2,024 | S$1.99m to S$3.60m |
Source: URA. Data to Nov 2026.
Scroll sideways to see the whole map.
- Geylang
- Freehold project
- Leasehold project
- MRT or LRT station
- Expressway
- Park
- Water
Source: URA, OneMap, LTA, NParks. Roads, rail lines and water © OpenStreetMap contributors.
“Shoebox” has no official definition. URA’s dwelling-unit guidelines (updated 7 June 2026) set the rules that matter. As a guide, every self-contained unit should have at least 35 sqm of internal area. Outside the Central Area, a development can have at most 20% of its units at 50 sqm or less, and must have at least 20% at 100 sqm or more. URA’s maps also list nine estates as “areas with 100sqm control”, including Marine Parade, Joo Chiat-Mountbatten and Telok Kurau-Jalan Eunos. Check the maps for your address. These rules cover new developments, so older projects can have smaller units.
| Rule | Guideline | Applies |
|---|---|---|
| Smallest unit | At least 35 sqm of internal area | Every self-contained unit |
| Small units (50 sqm or less) | At most 20% of units | Outside the Central Area |
| Large units (100 sqm or more) | At least 20% of units | Outside the Central Area |
Source: URA, maximum number of dwelling units (7 June 2026). These rules cover new developments, so older projects can have smaller units. 'Shoebox' has no official definition.
Smaller units show higher prices per sq ft but lower total prices. Say a 450 sq ft unit sells at S$2,000 per sq ft and a 700 sq ft unit at S$1,800. The first costs S$900,000 and the second S$1.26m. Compare both measures.
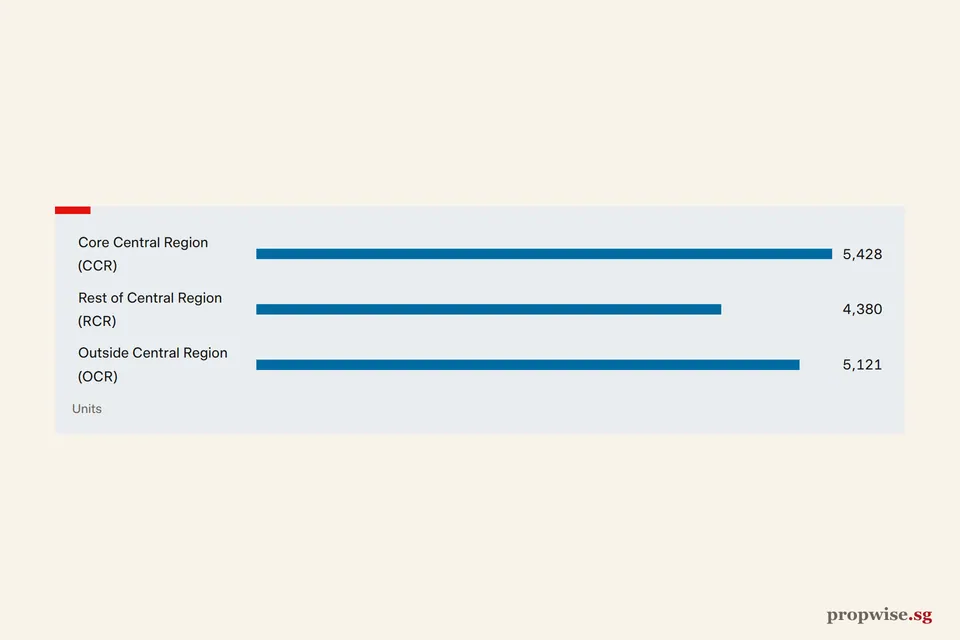
For the RCR, prices moved +0.8%, −1.2% and 0.0% in Q1, Q2 and the Q3 2026 final. The Q2 release shows RCR vacancy at 6.1% and 4,380 unsold units in uncompleted RCR projects. The nearest RCR land bids are at Bishan (S$17,350.26 per sqm of GFA) and Dover Drive in Queenstown (S$16,750.94).
S$ per sqm of GFA
Source: URA, Bishan award (2026); URA, Dover Drive award (31 March 2026).
- Core Central Region
- Rest of Central Region
- Outside Central Region
- Policy measures (select one for details)
Latest: CCR 162.0 (Q3 2026), down 0.9% on Q3 2025; RCR 226.2 (Q3 2026), up 0.3% on Q3 2025; OCR 277.3 (Q3 2026), up 5.4% on Q3 2025.
Table view
| Period | Core Central Region | Rest of Central Region | Outside Central Region |
|---|---|---|---|
| Q3 2026 | 162.0 | 226.2 | 277.3 |
| Q2 2026 | 161.5 | 226.2 | 271.1 |
| Q1 2026 | 158.6 | 228.9 | 271.4 |
| Q4 2025 | 157.7 | 227.1 | 265.6 |
| Q3 2025 | 163.4 | 225.5 | 263.0 |
| Q2 2025 | 160.7 | 224.8 | 260.9 |
| Q1 2025 | 156.0 | 227.3 | 258.1 |
| Q4 2024 | 154.8 | 223.5 | 257.3 |
| Q3 2024 | 150.9 | 217.0 | 249.1 |
| Q2 2024 | 152.6 | 215.3 | 249.1 |
| Q1 2024 | 153.1 | 211.9 | 248.6 |
| Q4 2023 | 148.1 | 211.3 | 248.1 |
| Q3 2023 | 142.5 | 213.0 | 237.4 |
| Q2 2023 | 146.5 | 208.6 | 225.0 |
| Q1 2023 | 146.6 | 213.9 | 222.3 |
| Q4 2022 | 145.4 | 204.9 | 218.2 |
| Q3 2022 | 144.4 | 198.7 | 224.0 |
| Q2 2022 | 141.2 | 193.3 | 208.4 |
| Q1 2022 | 138.6 | 181.7 | 204.1 |
| Q4 2021 | 138.7 | 186.7 | 199.7 |
| Q3 2021 | 135.1 | 175.0 | 188.9 |
| Q2 2021 | 135.8 | 170.6 | 189.1 |
| Q1 2021 | 134.3 | 170.4 | 185.6 |
| Q4 2020 | 133.6 | 160.6 | 183.6 |
| Q3 2020 | 129.5 | 153.8 | 180.4 |
| Q2 2020 | 134.6 | 150.0 | 177.4 |
| Q1 2020 | 131.1 | 152.6 | 177.2 |
| Q4 2019 | 134.1 | 153.4 | 177.9 |
| Q3 2019 | 138.0 | 155.4 | 173.1 |
| Q2 2019 | 135.3 | 153.4 | 171.7 |
| Q1 2019 | 132.3 | 148.2 | 171.0 |
| Q4 2018 | 136.4 | 149.2 | 170.7 |
| Q3 2018 | 137.8 | 146.6 | 169.5 |
| Q2 2018 | 136.0 | 148.5 | 169.7 |
| Q1 2018 | 134.8 | 140.6 | 164.8 |
| Q4 2017 | 127.8 | 138.9 | 156.1 |
| Q3 2017 | 126.0 | 138.3 | 154.9 |
| Q2 2017 | 125.9 | 137.6 | 153.7 |
| Q1 2017 | 126.5 | 136.8 | 154.2 |
| Q4 2016 | 127.0 | 136.4 | 154.0 |
| Q3 2016 | 126.9 | 139.2 | 154.9 |
| Q2 2016 | 129.4 | 140.6 | 156.5 |
| Q1 2016 | 129.0 | 140.3 | 157.3 |
| Q4 2015 | 128.6 | 140.3 | 159.4 |
| Q3 2015 | 129.0 | 140.9 | 159.4 |
| Q2 2015 | 130.6 | 143.2 | 162.0 |
| Q1 2015 | 131.4 | 144.1 | 163.8 |
| Q4 2014 | 131.9 | 146.6 | 165.6 |
| Q3 2014 | 133.1 | 148.6 | 167.0 |
| Q2 2014 | 134.2 | 149.2 | 167.6 |
| Q1 2014 | 136.2 | 149.7 | 169.1 |
| Q4 2013 | 137.6 | 154.8 | 169.3 |
| Q3 2013 | 140.5 | 154.2 | 170.9 |
| Q2 2013 | 140.9 | 155.6 | 167.3 |
| Q1 2013 | 141.2 | 155.3 | 161.1 |
| Q4 2012 | 140.3 | 155.0 | 158.9 |
| Q3 2012 | 139.4 | 153.6 | 153.2 |
| Q2 2012 | 139.2 | 152.3 | 151.6 |
| Q1 2012 | 138.4 | 151.7 | 150.9 |
| Q4 2011 | 139.2 | 152.5 | 149.2 |
| Q3 2011 | 138.5 | 152.4 | 148.4 |
| Q2 2011 | 137.5 | 150.6 | 145.3 |
| Q1 2011 | 135.3 | 148.9 | 142.8 |
| Q4 2010 | 133.9 | 145.9 | 138.6 |
| Q3 2010 | 131.0 | 143.3 | 135.8 |
| Q2 2010 | 128.9 | 140.0 | 132.9 |
| Q1 2010 | 122.4 | 133.8 | 125.7 |
| Q4 2009 | 117.2 | 124.1 | 120.5 |
| Q3 2009 | 109.2 | 113.3 | 113.4 |
| Q2 2009 | 94.8 | 95.6 | 97.7 |
| Q1 2009 | 100.0 | 100.0 | 100.0 |
| Q4 2008 | 119.4 | 120.4 | 107.9 |
| Q3 2008 | 127.6 | 128.3 | 114.6 |
| Q2 2008 | 131.2 | 131.5 | 116.3 |
| Q1 2008 | 131.3 | 130.6 | 115.2 |
| Q4 2007 | 126.5 | 126.4 | 111.0 |
| Q3 2007 | 117.7 | 117.4 | 103.7 |
| Q2 2007 | 108.6 | 108.7 | 96.1 |
| Q1 2007 | 100.7 | 100.6 | 89.7 |
| Q4 2006 | 95.4 | 96.9 | 87.9 |
| Q3 2006 | 90.9 | 94.8 | 86.5 |
| Q2 2006 | 86.3 | 94.4 | 85.8 |
| Q1 2006 | 82.5 | 94.4 | 84.5 |
| Q4 2005 | 81.5 | 94.1 | 84.3 |
| Q3 2005 | 79.7 | 94.1 | 83.6 |
| Q2 2005 | 77.9 | 94.1 | 83.6 |
| Q1 2005 | 77.6 | 93.7 | 83.6 |
| Q4 2004 | 76.9 | 92.9 | 83.4 |
| Q3 2004 | 76.4 | 92.2 | 83.0 |
| Q2 2004 | 76.1 | 91.6 | 82.7 |
| Q1 2004 | 76.0 | 91.5 | 83.0 |
Policy measures marked on this chart (22)
- 2025-07-03 Seller's Stamp Duty holding period back to four years, rates raised by 4 pp
- 2024-08-19 HDB loan LTV cut to 75% and Enhanced CPF Housing Grant raised
- 2023-04-26 ABSD rates raised, April 2023
- 2023-02-14 CPF Housing Grant raised for first-time resale buyers, Budget 2023
- 2023-02-14 Buyer's Stamp Duty raised for higher-value properties, Budget 2023
- 2022-09-29 Property measures, September 2022: higher TDSR and MSR rate floor, HDB loan LTV 80%, 15-month wait-out
- 2021-12-15 Property cooling measures, December 2021: higher ABSD, TDSR 55%, HDB loan LTV 85%
- 2018-07-05 Property cooling measures, July 2018: higher ABSD and lower LTV limits
- 2018-02-19 Budget 2018: Proximity Housing Grant enhanced
- 2018-02-19 Budget 2018: top BSD rate raised to 4% above S$1m
- 2017-03-10 SSD holding period cut to 3 years; TDSR relaxed for equity withdrawal
- 2013-08-27 HDB loan and resale measures, August 2013
- 2013-06-28 MAS introduces the Total Debt Servicing Ratio (TDSR) framework
- 2013-01-11 Property cooling measures, January 2013
- 2012-10-05 Maximum loan tenure of 35 years and tighter LTV limits, October 2012
- 2011-12-07 Additional Buyer's Stamp Duty introduced, December 2011
- 2011-01-13 Property cooling measures, January 2011
- 2010-08-30 HDB measures after National Day Rally 2010: DBSS income ceiling, 5-year MOP for non-subsidised flats
- 2010-08-30 Property cooling measures, August 2010
- 2010-02-19 Seller's Stamp Duty introduced and LTV limit cut to 80%, February 2010
- 2009-09-14 Interest-only loans and Interest Absorption Scheme disallowed, September 2009
- 2005-07-19 Property policy review, July 2005: LTV limit raised to 90%, CPF housing rules eased, foreign ownership rules eased
Source: URA. Data to Q3 2026.
Check a project’s sales on URA’s Property Market Information search. Banks cap debt at 55% of income and test loans at 4%. Use the Propwise mortgage calculator to test your numbers.
What is coming
Master Plan 2025 says Paya Lebar Air Base will move from the 2030s, freeing about 800 ha in the east for a new town. It will lift some building height limits around the base. URA mentions new rail lines and transit priority corridors there, with no dates. HDB’s 30 September 2026 release says the November 2026 BTO exercise includes Geylang.
Who it suits, and a checklist
Geylang may suit buyers who want city-fringe access and lower HDB entry prices than Queenstown or Bishan. It may suit less well if you want a quiet, uniform neighbourhood. See what makes a good location.
- Visit the street by day and at night.
- Check the unit’s internal area against the 35 sqm rule and compare it with other units in the project.
- Compare price per sq ft and total price.
- Check the tenure. See valuing leasehold property.
- Time the walk to the station.
- Check rents for the same size before you count on income.
Bottom line
Geylang offers rail access and lower HDB prices than its RCR neighbours, but it varies by street. Unit size rules and tenure matter more here than a list of “top” condos.