What Is the Rest of Central Region (RCR)? Condo Area Guide
What Rest of Central Region (RCR) means in 2026: URA's boundary, price and rent trends against CCR and OCR, HDB town benchmarks, land bids and a checklist.
The Rest of Central Region (RCR) is a statistical label that URA uses. It covers most of the city-fringe estates between the CBD and the suburbs. The 2018 version of this guide compared three RCR condos with prices and stamp duties that no longer apply, so this guide explains the segment with current data instead.
At a glance
- URA defines the Core Central Region (CCR) as postal districts 9, 10 and 11, the Downtown Core and Sentosa. RCR is the rest of the Central Region.
- RCR prices moved +0.8%, −1.2% and +0.2% in Q1, Q2 and the Q3 2026 flash estimate. That is about −0.2% overall, against about +2.3% for CCR and +4.3% for OCR.
- RCR had 4,380 unsold units in uncompleted projects at end-Q2 2026, the lowest of the three segments.
- The median 4-room HDB resale in Central Region towns ranged from S$637,500 to S$1.03m (Nov 2025–Oct 2026), against S$630,000 islandwide.
What the RCR covers
URA’s release notes say the CCR comprises postal districts 9, 10 and 11, the Downtown Core planning area and Sentosa. The RCR is the area in the Central Region outside those places. URA publishes a map of the boundary.
URA’s Master Plan 2019 boundary data list 22 planning areas in the Central Region. Adding up SingStat’s 2025 counts, about 975,000 residents live there, roughly 23% of Singapore’s 4.20 million residents. Queenstown, Bishan, Geylang, Toa Payoh, Kallang, Bukit Merah and Marine Parade are mostly RCR. The line follows postal districts, so a project in a planning area such as Novena or Bukit Timah can be CCR or RCR. Always check the district. Our guide to districts and planning areas explains how.
How the three segments compare in 2026
| CCR | RCR | OCR | |
|---|---|---|---|
| Price change Q1 / Q2 / Q3 flash | +0.6% / +1.8% / −0.1% | +0.8% / −1.2% / +0.2% | +2.2% / −0.1% / +2.2% |
| Compounded, three quarters | about +2.3% | about −0.2% | about +4.3% |
| Unsold units, uncompleted projects (end-Q2) | 5,428 | 4,380 | 5,121 |
| Rent index change, Q2 | +1.2% | 0.0% | −0.3% |
| Vacancy rate, Q2 | 8.3% | 6.1% | 5.6% |
Sources: URA releases for Q2 and the Q3 flash estimate. The compounding is our arithmetic, and flash estimates can be revised.
Units
Source: URA, 2Q 2026 real estate statistics (end-Q2 2026).
- Core Central Region
- Rest of Central Region
- Outside Central Region
- Policy measures (select one for details)
Latest: CCR 162.0 (Q3 2026), down 0.9% on Q3 2025; RCR 226.2 (Q3 2026), up 0.3% on Q3 2025; OCR 277.3 (Q3 2026), up 5.4% on Q3 2025.
Table view
| Period | Core Central Region | Rest of Central Region | Outside Central Region |
|---|---|---|---|
| Q3 2026 | 162.0 | 226.2 | 277.3 |
| Q2 2026 | 161.5 | 226.2 | 271.1 |
| Q1 2026 | 158.6 | 228.9 | 271.4 |
| Q4 2025 | 157.7 | 227.1 | 265.6 |
| Q3 2025 | 163.4 | 225.5 | 263.0 |
| Q2 2025 | 160.7 | 224.8 | 260.9 |
| Q1 2025 | 156.0 | 227.3 | 258.1 |
| Q4 2024 | 154.8 | 223.5 | 257.3 |
| Q3 2024 | 150.9 | 217.0 | 249.1 |
| Q2 2024 | 152.6 | 215.3 | 249.1 |
| Q1 2024 | 153.1 | 211.9 | 248.6 |
| Q4 2023 | 148.1 | 211.3 | 248.1 |
| Q3 2023 | 142.5 | 213.0 | 237.4 |
| Q2 2023 | 146.5 | 208.6 | 225.0 |
| Q1 2023 | 146.6 | 213.9 | 222.3 |
| Q4 2022 | 145.4 | 204.9 | 218.2 |
| Q3 2022 | 144.4 | 198.7 | 224.0 |
| Q2 2022 | 141.2 | 193.3 | 208.4 |
| Q1 2022 | 138.6 | 181.7 | 204.1 |
| Q4 2021 | 138.7 | 186.7 | 199.7 |
| Q3 2021 | 135.1 | 175.0 | 188.9 |
| Q2 2021 | 135.8 | 170.6 | 189.1 |
| Q1 2021 | 134.3 | 170.4 | 185.6 |
| Q4 2020 | 133.6 | 160.6 | 183.6 |
| Q3 2020 | 129.5 | 153.8 | 180.4 |
| Q2 2020 | 134.6 | 150.0 | 177.4 |
| Q1 2020 | 131.1 | 152.6 | 177.2 |
| Q4 2019 | 134.1 | 153.4 | 177.9 |
| Q3 2019 | 138.0 | 155.4 | 173.1 |
| Q2 2019 | 135.3 | 153.4 | 171.7 |
| Q1 2019 | 132.3 | 148.2 | 171.0 |
| Q4 2018 | 136.4 | 149.2 | 170.7 |
| Q3 2018 | 137.8 | 146.6 | 169.5 |
| Q2 2018 | 136.0 | 148.5 | 169.7 |
| Q1 2018 | 134.8 | 140.6 | 164.8 |
| Q4 2017 | 127.8 | 138.9 | 156.1 |
| Q3 2017 | 126.0 | 138.3 | 154.9 |
| Q2 2017 | 125.9 | 137.6 | 153.7 |
| Q1 2017 | 126.5 | 136.8 | 154.2 |
| Q4 2016 | 127.0 | 136.4 | 154.0 |
| Q3 2016 | 126.9 | 139.2 | 154.9 |
| Q2 2016 | 129.4 | 140.6 | 156.5 |
| Q1 2016 | 129.0 | 140.3 | 157.3 |
| Q4 2015 | 128.6 | 140.3 | 159.4 |
| Q3 2015 | 129.0 | 140.9 | 159.4 |
| Q2 2015 | 130.6 | 143.2 | 162.0 |
| Q1 2015 | 131.4 | 144.1 | 163.8 |
| Q4 2014 | 131.9 | 146.6 | 165.6 |
| Q3 2014 | 133.1 | 148.6 | 167.0 |
| Q2 2014 | 134.2 | 149.2 | 167.6 |
| Q1 2014 | 136.2 | 149.7 | 169.1 |
| Q4 2013 | 137.6 | 154.8 | 169.3 |
| Q3 2013 | 140.5 | 154.2 | 170.9 |
| Q2 2013 | 140.9 | 155.6 | 167.3 |
| Q1 2013 | 141.2 | 155.3 | 161.1 |
| Q4 2012 | 140.3 | 155.0 | 158.9 |
| Q3 2012 | 139.4 | 153.6 | 153.2 |
| Q2 2012 | 139.2 | 152.3 | 151.6 |
| Q1 2012 | 138.4 | 151.7 | 150.9 |
| Q4 2011 | 139.2 | 152.5 | 149.2 |
| Q3 2011 | 138.5 | 152.4 | 148.4 |
| Q2 2011 | 137.5 | 150.6 | 145.3 |
| Q1 2011 | 135.3 | 148.9 | 142.8 |
| Q4 2010 | 133.9 | 145.9 | 138.6 |
| Q3 2010 | 131.0 | 143.3 | 135.8 |
| Q2 2010 | 128.9 | 140.0 | 132.9 |
| Q1 2010 | 122.4 | 133.8 | 125.7 |
| Q4 2009 | 117.2 | 124.1 | 120.5 |
| Q3 2009 | 109.2 | 113.3 | 113.4 |
| Q2 2009 | 94.8 | 95.6 | 97.7 |
| Q1 2009 | 100.0 | 100.0 | 100.0 |
| Q4 2008 | 119.4 | 120.4 | 107.9 |
| Q3 2008 | 127.6 | 128.3 | 114.6 |
| Q2 2008 | 131.2 | 131.5 | 116.3 |
| Q1 2008 | 131.3 | 130.6 | 115.2 |
| Q4 2007 | 126.5 | 126.4 | 111.0 |
| Q3 2007 | 117.7 | 117.4 | 103.7 |
| Q2 2007 | 108.6 | 108.7 | 96.1 |
| Q1 2007 | 100.7 | 100.6 | 89.7 |
| Q4 2006 | 95.4 | 96.9 | 87.9 |
| Q3 2006 | 90.9 | 94.8 | 86.5 |
| Q2 2006 | 86.3 | 94.4 | 85.8 |
| Q1 2006 | 82.5 | 94.4 | 84.5 |
| Q4 2005 | 81.5 | 94.1 | 84.3 |
| Q3 2005 | 79.7 | 94.1 | 83.6 |
| Q2 2005 | 77.9 | 94.1 | 83.6 |
| Q1 2005 | 77.6 | 93.7 | 83.6 |
| Q4 2004 | 76.9 | 92.9 | 83.4 |
| Q3 2004 | 76.4 | 92.2 | 83.0 |
| Q2 2004 | 76.1 | 91.6 | 82.7 |
| Q1 2004 | 76.0 | 91.5 | 83.0 |
Policy measures marked on this chart (22)
- 2025-07-03 Seller's Stamp Duty holding period back to four years, rates raised by 4 pp
- 2024-08-19 HDB loan LTV cut to 75% and Enhanced CPF Housing Grant raised
- 2023-04-26 ABSD rates raised, April 2023
- 2023-02-14 CPF Housing Grant raised for first-time resale buyers, Budget 2023
- 2023-02-14 Buyer's Stamp Duty raised for higher-value properties, Budget 2023
- 2022-09-29 Property measures, September 2022: higher TDSR and MSR rate floor, HDB loan LTV 80%, 15-month wait-out
- 2021-12-15 Property cooling measures, December 2021: higher ABSD, TDSR 55%, HDB loan LTV 85%
- 2018-07-05 Property cooling measures, July 2018: higher ABSD and lower LTV limits
- 2018-02-19 Budget 2018: Proximity Housing Grant enhanced
- 2018-02-19 Budget 2018: top BSD rate raised to 4% above S$1m
- 2017-03-10 SSD holding period cut to 3 years; TDSR relaxed for equity withdrawal
- 2013-08-27 HDB loan and resale measures, August 2013
- 2013-06-28 MAS introduces the Total Debt Servicing Ratio (TDSR) framework
- 2013-01-11 Property cooling measures, January 2013
- 2012-10-05 Maximum loan tenure of 35 years and tighter LTV limits, October 2012
- 2011-12-07 Additional Buyer's Stamp Duty introduced, December 2011
- 2011-01-13 Property cooling measures, January 2011
- 2010-08-30 HDB measures after National Day Rally 2010: DBSS income ceiling, 5-year MOP for non-subsidised flats
- 2010-08-30 Property cooling measures, August 2010
- 2010-02-19 Seller's Stamp Duty introduced and LTV limit cut to 80%, February 2010
- 2009-09-14 Interest-only loans and Interest Absorption Scheme disallowed, September 2009
- 2005-07-19 Property policy review, July 2005: LTV limit raised to 90%, CPF housing rules eased, foreign ownership rules eased
Source: URA. Data to Q3 2026.
- Core Central Region
- Rest of Central Region
- Outside Central Region
Latest: CCR 152.4 (Q3 2026), up 2.1% on Q3 2025; RCR 174.9 (Q3 2026), up 1.9% on Q3 2025; OCR 174.2 (Q3 2026), up 1.8% on Q3 2025.
Table view
| Period | Core Central Region | Rest of Central Region | Outside Central Region |
|---|---|---|---|
| Q3 2026 | 152.4 | 174.9 | 174.2 |
| Q2 2026 | 152.9 | 172.3 | 169.0 |
| Q1 2026 | 151.1 | 172.3 | 169.5 |
| Q4 2025 | 150.3 | 172.6 | 167.8 |
| Q3 2025 | 149.3 | 171.6 | 171.2 |
| Q2 2025 | 150.0 | 168.6 | 167.0 |
| Q1 2025 | 147.3 | 168.6 | 166.8 |
| Q4 2024 | 146.7 | 167.9 | 165.6 |
| Q3 2024 | 145.4 | 167.4 | 166.9 |
| Q2 2024 | 147.8 | 164.6 | 163.3 |
| Q1 2024 | 147.9 | 166.9 | 165.5 |
| Q4 2023 | 150.3 | 170.1 | 167.8 |
| Q3 2023 | 152.7 | 172.2 | 172.6 |
| Q2 2023 | 155.3 | 169.0 | 170.4 |
| Q1 2023 | 152.3 | 165.7 | 165.6 |
| Q4 2022 | 143.1 | 156.0 | 156.1 |
| Q3 2022 | 133.4 | 145.4 | 144.3 |
| Q2 2022 | 124.7 | 132.7 | 132.6 |
| Q1 2022 | 115.8 | 125.3 | 123.1 |
| Q4 2021 | 111.6 | 119.7 | 118.4 |
| Q3 2021 | 108.5 | 116.4 | 115.6 |
| Q2 2021 | 107.7 | 114.6 | 112.7 |
| Q1 2021 | 104.5 | 111.5 | 108.8 |
| Q4 2020 | 101.6 | 109.3 | 106.6 |
| Q3 2020 | 102.8 | 108.3 | 105.6 |
| Q2 2020 | 105.0 | 108.0 | 104.6 |
| Q1 2020 | 105.6 | 110.1 | 105.5 |
| Q4 2019 | 104.1 | 109.4 | 103.5 |
| Q3 2019 | 105.2 | 110.2 | 104.5 |
| Q2 2019 | 105.9 | 108.5 | 103.7 |
| Q1 2019 | 104.3 | 107.0 | 102.5 |
| Q4 2018 | 102.7 | 107.3 | 100.8 |
| Q3 2018 | 103.3 | 107.8 | 102.5 |
| Q2 2018 | 104.2 | 106.2 | 101.6 |
| Q1 2018 | 103.4 | 105.8 | 100.8 |
| Q4 2017 | 102.8 | 106.1 | 100.1 |
| Q3 2017 | 103.5 | 106.8 | 101.1 |
| Q2 2017 | 104.3 | 105.8 | 101.4 |
| Q1 2017 | 104.2 | 106.2 | 102.0 |
| Q4 2016 | 104.9 | 107.5 | 101.6 |
| Q3 2016 | 105.3 | 107.6 | 103.7 |
| Q2 2016 | 106.8 | 108.2 | 106.3 |
| Q1 2016 | 106.7 | 108.9 | 107.6 |
| Q4 2015 | 108.5 | 109.6 | 108.9 |
| Q3 2015 | 108.9 | 111.4 | 110.9 |
| Q2 2015 | 109.3 | 112.3 | 112.1 |
| Q1 2015 | 110.7 | 113.5 | 113.2 |
| Q4 2014 | 112.8 | 115.3 | 115.3 |
| Q3 2014 | 114.1 | 115.5 | 116.2 |
| Q2 2014 | 116.3 | 115.8 | 116.2 |
| Q1 2014 | 116.4 | 115.9 | 117.3 |
| Q4 2013 | 117.1 | 115.6 | 118.3 |
| Q3 2013 | 117.8 | 115.6 | 119.2 |
| Q2 2013 | 117.4 | 114.9 | 120.1 |
| Q1 2013 | 116.8 | 114.8 | 120.1 |
| Q4 2012 | 115.8 | 114.7 | 119.2 |
| Q3 2012 | 115.1 | 114.0 | 117.8 |
| Q2 2012 | 114.4 | 112.9 | 115.9 |
| Q1 2012 | 114.6 | 112.1 | 114.8 |
| Q4 2011 | 114.0 | 111.7 | 114.5 |
| Q3 2011 | 113.9 | 110.4 | 113.9 |
| Q2 2011 | 113.4 | 109.4 | 112.7 |
| Q1 2011 | 112.5 | 108.4 | 111.1 |
| Q4 2010 | 111.1 | 108.0 | 109.4 |
| Q3 2010 | 108.7 | 104.0 | 105.9 |
| Q2 2010 | 104.9 | 100.3 | 102.3 |
| Q1 2010 | 98.7 | 95.5 | 96.3 |
| Q4 2009 | 93.7 | 91.8 | 91.9 |
| Q3 2009 | 92.9 | 91.7 | 91.9 |
| Q2 2009 | 94.9 | 93.9 | 94.1 |
| Q1 2009 | 100.0 | 100.0 | 100.0 |
| Q4 2008 | 111.4 | 107.8 | 106.9 |
| Q3 2008 | 118.7 | 114.6 | 111.7 |
| Q2 2008 | 119.5 | 115.2 | 114.8 |
| Q1 2008 | 116.2 | 114.0 | 113.4 |
| Q4 2007 | 110.9 | 106.9 | 104.7 |
| Q3 2007 | 105.3 | 98.3 | 96.5 |
| Q2 2007 | 93.9 | 87.8 | 86.3 |
| Q1 2007 | 83.8 | 79.8 | 78.9 |
| Q4 2006 | 77.9 | 72.7 | 73.7 |
| Q3 2006 | 73.9 | 68.7 | 69.4 |
| Q2 2006 | 69.3 | 64.8 | 67.3 |
| Q1 2006 | 66.3 | 62.3 | 65.8 |
| Q4 2005 | 65.0 | 61.0 | 65.7 |
| Q3 2005 | 64.1 | 60.8 | 65.3 |
| Q2 2005 | 63.6 | 60.4 | 65.0 |
| Q1 2005 | 63.3 | 60.3 | 64.6 |
| Q4 2004 | 62.5 | 61.5 | 64.3 |
| Q3 2004 | 62.8 | 62.8 | 63.8 |
| Q2 2004 | 63.5 | 65.0 | 63.1 |
| Q1 2004 | 63.3 | 65.6 | 63.1 |
Source: URA. Data to Q3 2026.
The neighbourhoods behind the label
The table lists the 12 RCR condos with the most single-unit deals in the last 12 months, with their tenure, sizes sold and recent prices per sq ft. The map shows where they stand.
| Condo | Street | Tenure | Homes | Unit types | Sizes (sq ft) | Deals | Median psf | Prices |
|---|---|---|---|---|---|---|---|---|
| Union Square Residences | Havelock Road | 99 yrs, 2024 | 366 | 1 BR (102), 2 BR (169), 3 BR (57), 4 BR (35), 5 BR (3) | 463 to 4,833 | 155 new | S$2,817 | S$1.28m to S$18.50m |
| One Marina Gardens | Marina Gardens Lane | 99 yrs, 2023 | 937 | 1-4 BR | 420 to 1,647 | 140 new | S$3,019 | S$1.84m to S$5.42m |
| Arina East Residences | Tanjong Rhu Road | Freehold | 107 | 1-4 BR | 495 to 1,679 | 82 new | S$2,773 | S$1.29m to S$4.29m |
| Stirling Residences | Stirling Road | 99 yrs, 2017 | 1,259 | 1-4 BR | 441 to 1,345 | 95 | S$2,410 | S$1.00m to S$3.58m |
| Bloomsbury Residences | Media Circle | 99 yrs, 2024 | 358 | 2-4 BR, PH | 570 to 2,131 | 89 new | S$2,573 | S$1.67m to S$4.61m |
| Hudson Place Residences | Media Circle | 99 yrs, 2025 | 327 | 2-4 BR, PH | 646 to 1,744 | 242 new | S$2,487 | S$1.46m to S$4.61m |
| The Continuum | Thiam Siew Avenue | Freehold | 816 | 1-5 BR | 560 to 2,260 | 176 new | S$2,752 | S$1.34m to S$6.15m |
| Normanton Park | Normanton Park | 99 yrs, 2019 | 1,862 | 1-5 BR, PH, villas | 495 to 1,615 | 106 | S$2,007 | S$0.87m to S$2.91m |
| Terra Hill | Yew Siang Road | Freehold | 270 | 2-5 BR | 624 to 3,035 | 96 new | S$2,468 | S$1.90m to S$7.28m |
| Parc Esta | Sims Avenue | 99 yrs, 2018 | 1,399 | 1-5 BR | 420 to 1,410 | 99 | S$2,323 | S$0.89m to S$3.60m |
| Thomson Reserve | Bright Hill Drive | 99-year | – | – | 592 to 1,808 | 1,147 new | S$2,863 | S$1.54m to S$5.98m |
| The Sen | Jalan Jurong Kechil | 99 yrs, 2025 | 348 | 1 BR (10), 2 BR (168), 3 BR (130), 4 BR (40) | 452 to 1,453 | 119 new | S$2,345 | S$1.51m to S$3.15m |
Source: URA. Data to Nov 2026.
Scroll sideways to see the whole map.
- Rest of Central Region
- Freehold project
- Leasehold project
- MRT or LRT station
- Expressway
- Park
- Water
Source: URA, OneMap, LTA, NParks. Roads, rail lines and water © OpenStreetMap contributors.
The three estate guides below show how far apart RCR numbers are.
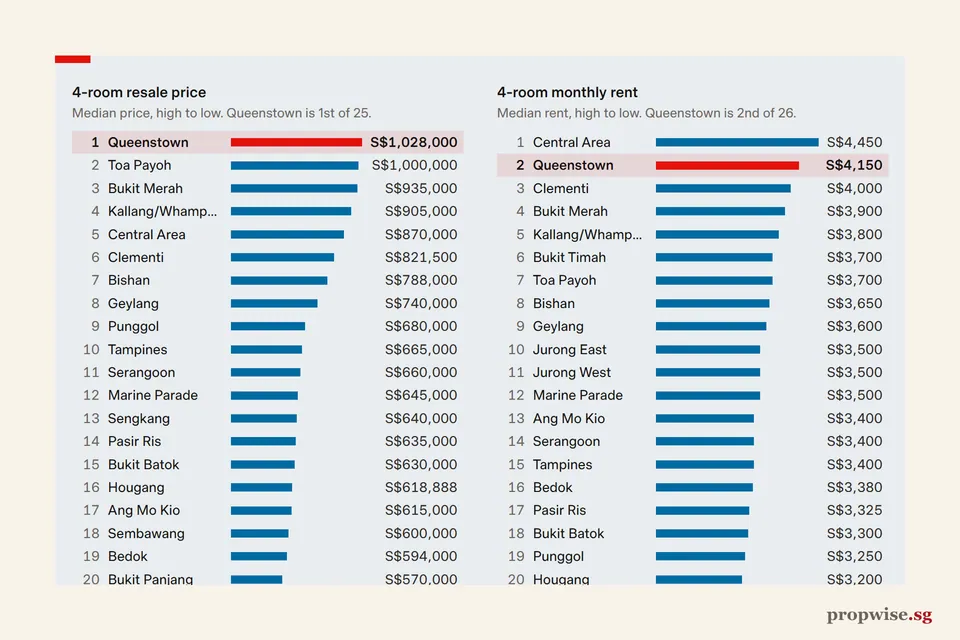
- Queenstown: East-West and Circle lines, with the highest HDB 4-room median of the group.
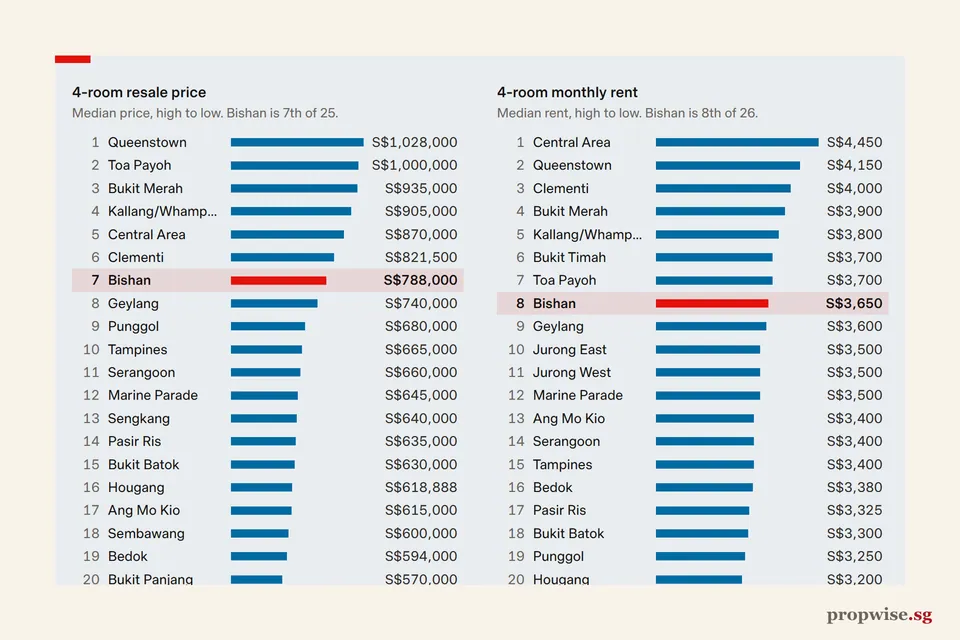
- Bishan: North-South, Circle and Thomson-East Coast lines, with a town centre to be rejuvenated.
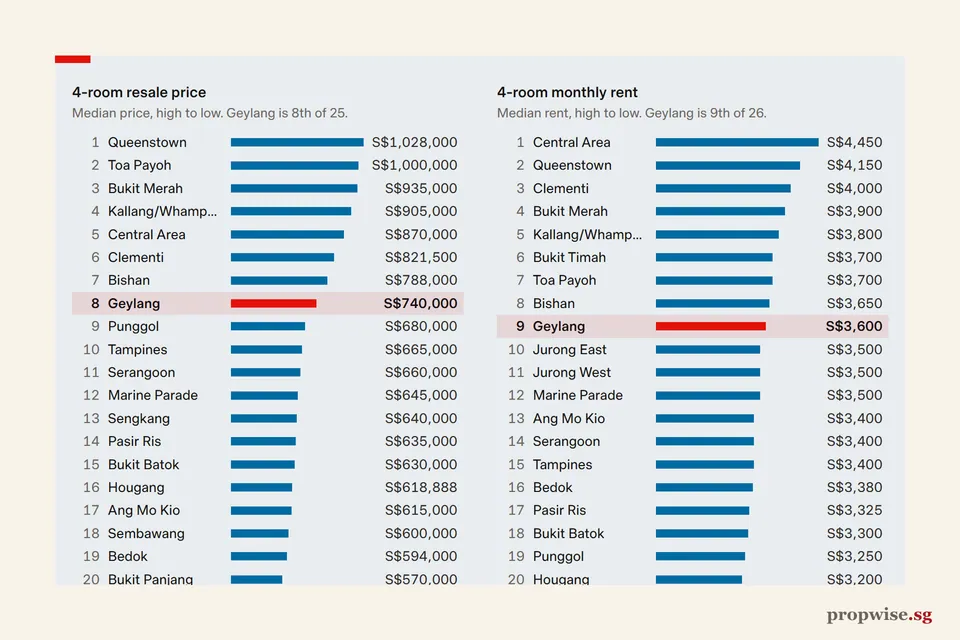
- Geylang: older flats, three MRT lines and one of the lowest 4-room medians.
By contrast, Robertson Quay sits in postal district 9, so it is CCR.
It shows eight Central Region HDB towns. School counts come from MOE’s directory.
| HDB town | 4-room resales | Median price | Median 4-room rent | MOE schools in zone |
|---|---|---|---|---|
| Queenstown | 323 | S$1,030,000 | S$4,200 | 9 |
| Toa Payoh | 428 | S$1,000,888 | S$3,700 | 15 |
| Bukit Merah | 403 | S$938,000 | S$3,950 | 11 |
| Kallang/Whampoa | 316 | S$900,000 | S$3,800 | 6 |
| Central Area | 81 | S$870,000 | no data | n/a |
| Bishan | 200 | S$788,000 | S$3,650 | 9 |
| Geylang | 230 | S$740,000 | S$3,650 | 8 |
| Marine Parade | 38 | S$637,500 | S$3,500 | 7 |
| Islandwide | 11,101 | S$630,000 | S$3,350 | — |
Source: HDB, Nov 2025–Oct 2026.
Marine Parade has few resales, so treat its median with care.
What developers are paying
Land bids tell you what the next launches will cost, before construction and profit. Each figure is the winning bid per sqm of gross floor area (GFA).
| Site (URA award date) | Segment | Winning bid | Bids |
|---|---|---|---|
| River Valley Green Parcel C (23 Jun 2026) | CCR | S$18,621.77 | 4 |
| Lorong Puntong / Sin Ming Avenue (18 Sep 2026) | RCR (Bishan) | S$17,350.26 | 7 |
| Dover Drive (31 Mar 2026) | RCR (Queenstown) | S$16,750.94 | 6 |
The CCR site sold about 11% above the Dover Drive site. Land is only one input, and the sites differ in size and layout.
S$ per sqm of GFA
Source: URA, River Valley Green Parcel C (23 June 2026); URA, Lorong Puntong / Sin Ming Avenue (18 September 2026); URA, Dover Drive (31 March 2026). Sites differ in size and layout. Number of bids: River Valley 4, Sin Ming 7, Dover Drive 6.
What is coming
URA’s 2H2026 land programme brings the 2026 Confirmed List to 9,320 units, over 50% above the 10-year average. About 25,900 private and EC units are due to complete by 2028 (URA Annex E-3). More supply can cap price gains.
Master Plan 2025 plans new neighbourhoods at Pearl’s Hill, Paterson, Newton and Dover-Medway, and a rejuvenated Bishan town centre. Paya Lebar Air Base will move from the 2030s, freeing about 800 ha in the east. LTA opened the Circle Line 6 extension (Keppel, Cantonment and Prince Edward Road) on 12 July 2026, closing the loop.
Who it suits, and a checklist
RCR may suit buyers who want a city-fringe location and can accept a smaller choice of new launches near each other than in the suburbs. If you own an HDB flat, a condo counts as a second property for ABSD. A citizen pays 20%, refundable for married couples who sell the first home in time. Run the loan in the mortgage calculator.
- Check the postal district and the URA segment.
- Read URA’s recent sales for the project, not asking prices.
- Check the lease. See valuing leasehold property.
- Compare the rent and vacancy trend, not only the price trend.
- Measure the walk to the MRT station.
Bottom line
RCR is a price label with very different estates inside it. In 2026 its prices are flat while OCR and CCR gained, and its unsold stock is the lowest of the three. Judge the estate and the project, not the label.
1 reader comment
Tom Tyman
It’s really a very hard decision to make. But I guess it all boils down to what someone wants and how much he can afford. Thanks for sharing this!