Condos Near Robertson Quay: Area Guide (2026)
Robertson Quay condos for 2026: 12 projects compared on tenure, homes, unit types, sizes and price per sq ft, with a price map, MRT and school data.
Robertson Quay is a riverside strip in the Core Central Region (CCR), where condos cost more and the buyer pool is wider than in the suburbs. The 2018 version of this guide compared riverside condos using an old stamp-duty regime and old prices. Neither applies now, so this guide covers the location, the data and the checks instead.
At a glance
- Robertson Quay falls in the Singapore River planning area, next to River Valley. Its postcodes start with 238 or 239, and URA’s list of postal districts puts sector 23 in district 9, part of the CCR.
- Two Thomson-East Coast Line (TEL) stations, Havelock and Great World, are about 0.2–0.5 km away in a straight line.
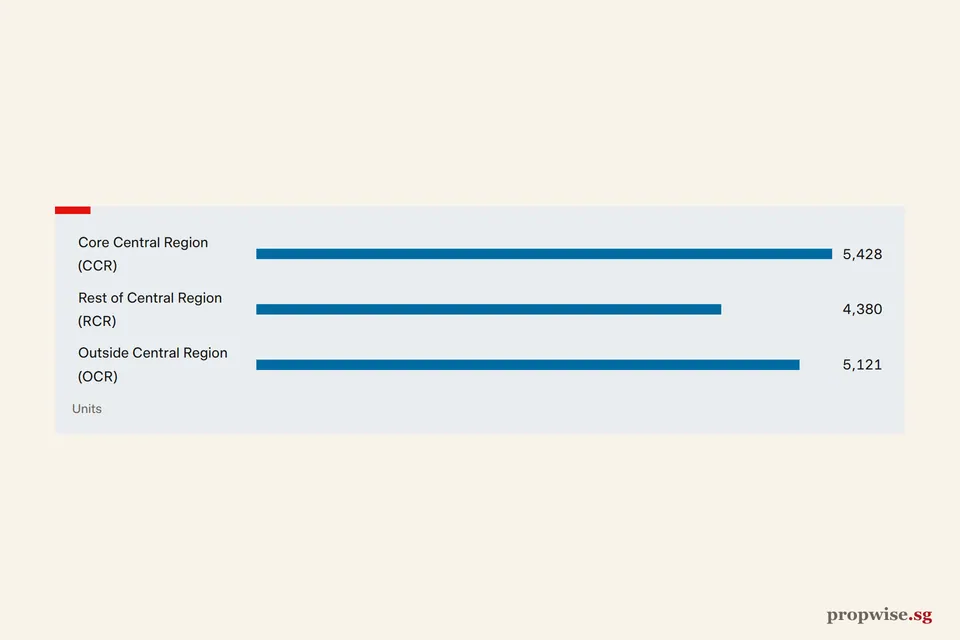
- CCR prices moved +1.8% in Q2 2026 and −0.1% in the Q3 flash estimate. CCR vacancy was 8.3% at end-Q2, the highest of the three segments.
- URA sold the nearby River Valley Green Parcel C site on 23 Jun 2026 at S$18,621.77 per sqm of GFA.
Which condos are on the quay
Twelve condos sit within about 550 m of the quay. The table lists each one with its tenure, number of homes, unit types, the sizes that have changed hands and what its recent deals cost per sq ft. The map plots the same projects.
| Condo | Street | Tenure | Homes | Unit types | Sizes (sq ft) | Deals | Median psf | Prices |
|---|---|---|---|---|---|---|---|---|
| Rivergate | Robertson Quay | Freehold | 545 | 2 BR (103), 3 BR (267), 4 BR (170) | 1,023 to 2,088 | 11 | S$3,071 | S$3.10m to S$6.36m |
| Up@Robertson Quay | Robertson Quay | 99 yrs, 2011 | 70 | 1 BR (43), 2 BR (27) | 463 to 1,119 | 2 | S$2,035* | S$1.16m to S$2.28m |
| Riviere | Jiak Kim Street | 99 yrs, 2018 | 455 | 1-4 BR | 560 to 2,002 | 10 | S$2,851 | S$1.44m to S$4.29m |
| Robertson 100 | Robertson Quay | Freehold | 186 | 1 BR (18), 2 BR (88), 3 BR (80) | 678 to 1,561 | 4 | S$2,421* | S$2.10m to S$2.88m |
| Robertson Blue | Robertson Quay | Freehold | 36 | 2 BR (27), 3 BR (9) | 1,238 to 1,862 | 2 | S$2,134* | S$3.05m to S$3.28m |
| Watermark Robertson Quay | Rodyk Street | Freehold | 206 | 2, 3 BR, PH | 893 to 1,873 | 6 | S$2,332 | S$2.15m to S$3.90m |
| Oleanas Residence | Kim Yam Road | Freehold | 130 | 2-4 BR | 1,141 to 1,668 | 1 | S$2,053* | S$2,518,888 |
| The Quayside | Robertson Quay | 99 yrs, 1994 | 79 | 2, 3 BR, PH | 1,130 to 1,711 | 5 | S$1,711 | S$1.76m to S$2.82m |
| The Pier at Robertson | Mohamed Sultan Road | Freehold | 201 | 1-3 BR | 657 to 1,281 | 5 | S$2,323 | S$1.50m to S$2.88m |
| Waterford Residence | Kim Yam Road | 999 yrs, 1841 | 118 | 1 BR (2), 2 BR (45), 3 BR (71) | 980 to 2,196 | 8 | S$2,121 | S$2.19m to S$3.53m |
| The Iveria | Kim Yam Road | Freehold | 51 | 3 BR (51) | 904 to 947 | 1 | S$2,599* | S$2,350,000 |
| The Robertson Opus | Unity Street | 999 yrs, 1841 | 348 | Suite (40), 1 BR (40), 2 BR (150), 3 BR (109), 4 BR (9) | 431 to 1,539 | 23 new | S$3,365 | S$1.30m to S$3.44m |
Source: URA. Data to Nov 2026.
Scroll sideways to see the whole map.
- Robertson Quay
- Freehold project
- Leasehold project
- MRT or LRT station
- Expressway
- Park
- Water
Source: URA, OneMap, LTA, NParks. Roads, rail lines and water © OpenStreetMap contributors.
Tenure splits the list in three. Rivergate, Robertson 100, Robertson Blue, Watermark Robertson Quay, The Pier at Robertson, Oleanas Residence and The Iveria are freehold. The Robertson Opus and Waterford Residence hold 999-year leases from 1841.
Riviere (from 2018), UP@Robertson Quay (from 2011) and The Quayside (from 1994) are 99-year leases, so lease decay counts for them. See valuing leasehold property.
Size and age shape the price as much as the address. Rivergate, at 545 homes, is the biggest block on the quay. Its sizes run from two-bedroom homes to large penthouses.
Boutique blocks such as Robertson Blue and The Iveria trade rarely, so one deal can move their median. Their psf is a guide, not a price.
The Robertson Opus is the only project here that mostly sells new homes. Compare its new-sale psf with resale psf only with care, because new homes carry the developer’s price.
Check any shortlisted project on URA’s Property Market Information search, which lists each deal with its floor band, area and price. Ask an agent for stack and unit details, because URA does not publish unit numbers.
The area in numbers
SingStat’s 2025 survey counts 4,630 residents in the Singapore River planning area and 12,700 in River Valley. Almost all live in condos and other apartments (4,500 and 11,890). The survey shows no HDB residents in either area.
The residents are younger than average. About 9% of Singapore River residents and 14% of River Valley residents are 65 or older, against 19% for all residents and 23% in Queenstown (SingStat’s age table). Counts are rounded to the nearest 10 and come from a survey, so treat small differences with care.
% of residents aged 65 and over
Source: SingStat, resident population by age (2025 survey). Counts are rounded and come from a survey, so treat small differences with care.
We placed Robertson Quay in the Singapore River area by matching OneMap’s location for the quay to URA’s planning-area boundary. URA’s CCR map shades postal districts 9, 10 and 11 as CCR.
MRT, roads and schools
LTA opened TEL Stage 3 on 13 November 2022, with Great World and Havelock among its stations. Great World is TE15 and Havelock is TE16. From points along the quay, our straight-line distances (from LTA exit data) are 0.24–0.40 km to Havelock, 0.34–0.47 km to Great World and 0.76–0.93 km to Fort Canning (DT20). Real walks are longer, so time them. TEL connects with the North-South Line at Orchard, the East-West and North East lines at Outram Park, and the Circle Line at Marina Bay.
Thomson-East Coast Line
- OrchardNorth-South Line
- Great World TE150.34 to 0.47 km from the quay
- Havelock TE160.24 to 0.40 km from the quay
- Outram ParkEast-West LineNorth East Line
- Marina BayCircle Line
Downtown Line
- Fort Canning DT200.76 to 0.93 km from the quay
Source: LTA, Thomson-East Coast Line (October 2026); LTA MRT station exits (data.gov.sg). Schematic, not to scale. Stations between Outram Park and Marina Bay are not shown. Time the real walk before you buy.
URA plans to turn lanes on Zion Road into a wider footpath and cycling path by 2026, and to add cycling paths between Outram and Orchard by 2030.
MOE’s school directory lists River Valley Primary School at River Valley Green, about 0.36–0.40 km in a straight line from the quay. For Primary 1, MOE ranks applicants by home-to-school distance in bands of 1 km and 2 km, and you must live at the address for 30 months from the start of registration. MOE measures the distance, so confirm it before you buy.
Rent and HDB yardsticks
There is no HDB town here, so use two other yardsticks. First, URA’s CCR rent index rose 1.2% quarter-on-quarter in Q2 2026. Vacancy in the CCR was 8.3%, against 6.1% in the RCR and 5.6% in the OCR. A high vacancy rate gives tenants more choice, which matters if you plan to rent out.
% of private residential stock vacant
Source: URA, Q2 2026 real estate statistics (End-Q2 2026).
Second, HDB flats on Havelock Road in Bukit Merah give a nearby comparison. The 5-room sample is too small to use.
| Flat type (Havelock Road) | Resales | Median resale price | Median monthly rent (contracts) |
|---|---|---|---|
| 3-room | 24 | S$815,000 | S$3,150 (42) |
| 4-room | 17 | S$1,100,000 | S$4,250 (20) |
Source: HDB, Oct 2025–Sep 2026.
The condo market here
URA’s CCR index rose 0.6% quarter-on-quarter in Q1, 1.8% in Q2 and fell 0.1% in the Q3 flash estimate. In all, 5,428 units remained unsold in uncompleted CCR projects at end-Q2. Check a project’s recent sales on URA’s Property Market Information search.
- Core Central Region
- Rest of Central Region
- Outside Central Region
- Policy measures (select one for details)
Latest: CCR 162.0 (Q3 2026), down 0.9% on Q3 2025; RCR 226.2 (Q3 2026), up 0.3% on Q3 2025; OCR 277.3 (Q3 2026), up 5.4% on Q3 2025.
Table view
| Period | Core Central Region | Rest of Central Region | Outside Central Region |
|---|---|---|---|
| Q3 2026 | 162.0 | 226.2 | 277.3 |
| Q2 2026 | 161.5 | 226.2 | 271.1 |
| Q1 2026 | 158.6 | 228.9 | 271.4 |
| Q4 2025 | 157.7 | 227.1 | 265.6 |
| Q3 2025 | 163.4 | 225.5 | 263.0 |
| Q2 2025 | 160.7 | 224.8 | 260.9 |
| Q1 2025 | 156.0 | 227.3 | 258.1 |
| Q4 2024 | 154.8 | 223.5 | 257.3 |
| Q3 2024 | 150.9 | 217.0 | 249.1 |
| Q2 2024 | 152.6 | 215.3 | 249.1 |
| Q1 2024 | 153.1 | 211.9 | 248.6 |
| Q4 2023 | 148.1 | 211.3 | 248.1 |
| Q3 2023 | 142.5 | 213.0 | 237.4 |
| Q2 2023 | 146.5 | 208.6 | 225.0 |
| Q1 2023 | 146.6 | 213.9 | 222.3 |
| Q4 2022 | 145.4 | 204.9 | 218.2 |
| Q3 2022 | 144.4 | 198.7 | 224.0 |
| Q2 2022 | 141.2 | 193.3 | 208.4 |
| Q1 2022 | 138.6 | 181.7 | 204.1 |
| Q4 2021 | 138.7 | 186.7 | 199.7 |
| Q3 2021 | 135.1 | 175.0 | 188.9 |
| Q2 2021 | 135.8 | 170.6 | 189.1 |
| Q1 2021 | 134.3 | 170.4 | 185.6 |
| Q4 2020 | 133.6 | 160.6 | 183.6 |
| Q3 2020 | 129.5 | 153.8 | 180.4 |
| Q2 2020 | 134.6 | 150.0 | 177.4 |
| Q1 2020 | 131.1 | 152.6 | 177.2 |
| Q4 2019 | 134.1 | 153.4 | 177.9 |
| Q3 2019 | 138.0 | 155.4 | 173.1 |
| Q2 2019 | 135.3 | 153.4 | 171.7 |
| Q1 2019 | 132.3 | 148.2 | 171.0 |
| Q4 2018 | 136.4 | 149.2 | 170.7 |
| Q3 2018 | 137.8 | 146.6 | 169.5 |
| Q2 2018 | 136.0 | 148.5 | 169.7 |
| Q1 2018 | 134.8 | 140.6 | 164.8 |
| Q4 2017 | 127.8 | 138.9 | 156.1 |
| Q3 2017 | 126.0 | 138.3 | 154.9 |
| Q2 2017 | 125.9 | 137.6 | 153.7 |
| Q1 2017 | 126.5 | 136.8 | 154.2 |
| Q4 2016 | 127.0 | 136.4 | 154.0 |
| Q3 2016 | 126.9 | 139.2 | 154.9 |
| Q2 2016 | 129.4 | 140.6 | 156.5 |
| Q1 2016 | 129.0 | 140.3 | 157.3 |
| Q4 2015 | 128.6 | 140.3 | 159.4 |
| Q3 2015 | 129.0 | 140.9 | 159.4 |
| Q2 2015 | 130.6 | 143.2 | 162.0 |
| Q1 2015 | 131.4 | 144.1 | 163.8 |
| Q4 2014 | 131.9 | 146.6 | 165.6 |
| Q3 2014 | 133.1 | 148.6 | 167.0 |
| Q2 2014 | 134.2 | 149.2 | 167.6 |
| Q1 2014 | 136.2 | 149.7 | 169.1 |
| Q4 2013 | 137.6 | 154.8 | 169.3 |
| Q3 2013 | 140.5 | 154.2 | 170.9 |
| Q2 2013 | 140.9 | 155.6 | 167.3 |
| Q1 2013 | 141.2 | 155.3 | 161.1 |
| Q4 2012 | 140.3 | 155.0 | 158.9 |
| Q3 2012 | 139.4 | 153.6 | 153.2 |
| Q2 2012 | 139.2 | 152.3 | 151.6 |
| Q1 2012 | 138.4 | 151.7 | 150.9 |
| Q4 2011 | 139.2 | 152.5 | 149.2 |
| Q3 2011 | 138.5 | 152.4 | 148.4 |
| Q2 2011 | 137.5 | 150.6 | 145.3 |
| Q1 2011 | 135.3 | 148.9 | 142.8 |
| Q4 2010 | 133.9 | 145.9 | 138.6 |
| Q3 2010 | 131.0 | 143.3 | 135.8 |
| Q2 2010 | 128.9 | 140.0 | 132.9 |
| Q1 2010 | 122.4 | 133.8 | 125.7 |
| Q4 2009 | 117.2 | 124.1 | 120.5 |
| Q3 2009 | 109.2 | 113.3 | 113.4 |
| Q2 2009 | 94.8 | 95.6 | 97.7 |
| Q1 2009 | 100.0 | 100.0 | 100.0 |
| Q4 2008 | 119.4 | 120.4 | 107.9 |
| Q3 2008 | 127.6 | 128.3 | 114.6 |
| Q2 2008 | 131.2 | 131.5 | 116.3 |
| Q1 2008 | 131.3 | 130.6 | 115.2 |
| Q4 2007 | 126.5 | 126.4 | 111.0 |
| Q3 2007 | 117.7 | 117.4 | 103.7 |
| Q2 2007 | 108.6 | 108.7 | 96.1 |
| Q1 2007 | 100.7 | 100.6 | 89.7 |
| Q4 2006 | 95.4 | 96.9 | 87.9 |
| Q3 2006 | 90.9 | 94.8 | 86.5 |
| Q2 2006 | 86.3 | 94.4 | 85.8 |
| Q1 2006 | 82.5 | 94.4 | 84.5 |
| Q4 2005 | 81.5 | 94.1 | 84.3 |
| Q3 2005 | 79.7 | 94.1 | 83.6 |
| Q2 2005 | 77.9 | 94.1 | 83.6 |
| Q1 2005 | 77.6 | 93.7 | 83.6 |
| Q4 2004 | 76.9 | 92.9 | 83.4 |
| Q3 2004 | 76.4 | 92.2 | 83.0 |
| Q2 2004 | 76.1 | 91.6 | 82.7 |
| Q1 2004 | 76.0 | 91.5 | 83.0 |
Policy measures marked on this chart (22)
- 2025-07-03 Seller's Stamp Duty holding period back to four years, rates raised by 4 pp
- 2024-08-19 HDB loan LTV cut to 75% and Enhanced CPF Housing Grant raised
- 2023-04-26 ABSD rates raised, April 2023
- 2023-02-14 CPF Housing Grant raised for first-time resale buyers, Budget 2023
- 2023-02-14 Buyer's Stamp Duty raised for higher-value properties, Budget 2023
- 2022-09-29 Property measures, September 2022: higher TDSR and MSR rate floor, HDB loan LTV 80%, 15-month wait-out
- 2021-12-15 Property cooling measures, December 2021: higher ABSD, TDSR 55%, HDB loan LTV 85%
- 2018-07-05 Property cooling measures, July 2018: higher ABSD and lower LTV limits
- 2018-02-19 Budget 2018: Proximity Housing Grant enhanced
- 2018-02-19 Budget 2018: top BSD rate raised to 4% above S$1m
- 2017-03-10 SSD holding period cut to 3 years; TDSR relaxed for equity withdrawal
- 2013-08-27 HDB loan and resale measures, August 2013
- 2013-06-28 MAS introduces the Total Debt Servicing Ratio (TDSR) framework
- 2013-01-11 Property cooling measures, January 2013
- 2012-10-05 Maximum loan tenure of 35 years and tighter LTV limits, October 2012
- 2011-12-07 Additional Buyer's Stamp Duty introduced, December 2011
- 2011-01-13 Property cooling measures, January 2011
- 2010-08-30 HDB measures after National Day Rally 2010: DBSS income ceiling, 5-year MOP for non-subsidised flats
- 2010-08-30 Property cooling measures, August 2010
- 2010-02-19 Seller's Stamp Duty introduced and LTV limit cut to 80%, February 2010
- 2009-09-14 Interest-only loans and Interest Absorption Scheme disallowed, September 2009
- 2005-07-19 Property policy review, July 2005: LTV limit raised to 90%, CPF housing rules eased, foreign ownership rules eased
Source: URA. Data to Q3 2026.
Land bids give a cost floor. URA awarded River Valley Green Parcel C for S$750.57m on a maximum 40,306 sqm of GFA. That is S$18,621.77 per sqm, about S$1,730 per sq ft, before construction and profit. Four bids came in, and the next best was S$17,881.21. The site is about 0.3–0.4 km from the quay. Nearby, a Reserve List site at Morrison Lane can yield about 205 units. A Reserve List site launches only if a developer applies.
S$ per sqm of GFA
Source: URA, River Valley Green Parcel C award (23 June 2026); URA, tender bids. S$750.57m on a maximum 40,306 sqm of GFA, four bids. The site is about 0.3 to 0.4 km from the quay.
Buyer type matters. ABSD is 60% for foreigners, 5% on a PR’s first home and 0% on a citizen’s first home. Banks cap debt at 55% of income and test loans at 4%. Model your loan in the Propwise mortgage calculator.
What is coming
Master Plan 2025 plans a new neighbourhood at Pearl’s Hill and a mixed-use hub at Paterson, above Orchard MRT station, with a route towards the River Valley area. URA also says its Singapore River One business improvement district has produced positive results. New neighbourhoods will be paced out, and URA gives no dates.
Who it suits, and a checklist
Robertson Quay may suit buyers who want a walkable riverside, two TEL stations and a short ride to the CBD. It may suit families less if school priority matters, and noise from the quay’s bars may bother some residents. See what makes a good location for how to weigh these.
- Confirm the postal district and the tenure. See valuing leasehold property.
- Time the walk to Havelock or Great World.
- Visit on a weekday morning and a Friday night.
- Compare recent sales for the same project and size on URA’s search.
- Check the rent and vacancy trend before you count on rental income.
- Work out ABSD for your buyer status first.
Bottom line
Robertson Quay is a CCR location with good rail links and a young, apartment-based resident base. The price index and vacancy data both say the segment is mixed in 2026. Compare projects on recent sales, tenure and walk time, not on old lists.