SORA Rate Today: What the 3-Month Compounded Rate Says
The 3-month compounded SORA is the benchmark many floating home loans follow. Its latest reading, the fall from the peak, and what it can't tell you.
The 3-month compounded SORA was 1.32% on 4 Nov 2026. Its peak was 3.76% on 3 November 2023, according to the MAS series. It has moved +0.08 pp since 5 Oct 2026.
What the number is
The Singapore Overnight Rate Average (SORA) is the volume-weighted average rate of borrowing in the unsecured overnight interbank SGD cash market. That is the definition from the Monetary Authority of Singapore (MAS).
MAS publishes the 1-month, 3-month and 6-month compounded SORA each day alongside it.
The 3-month figure smooths out the day-to-day noise of the overnight rate. Think of it as a calm cousin of the daily number, so one odd day does not send the whole line zigzagging.
Many bank packages for floating-rate home loans quote a spread over it, as in our comparison of HDB loans and bank loans. Each bank and package sets its own spread.
Where it stands against the past few years
Here are readings from the MAS series on the first working day of October:
| Date | 3-month compounded SORA |
|---|---|
| 2 Oct 2023 | 3.70% |
| 1 Oct 2024 | 3.50% |
| 1 Oct 2025 | 1.45% |
| 1 Oct 2026 | 1.23% |
The big drop came between October 2024 and October 2025, when the rate fell by about two percentage points. Over the year to 1 October 2026 it fell by a further 0.2 points.
In 2026 the low so far was about 1.02% in late April. The rate stands at 1.32% now.
Latest: SORA 1.32% (4 Nov 2026).
SORA is the benchmark for floating-rate home loans in Singapore. Your bank adds its own spread.
Table view
| Period | 3-month compounded SORA |
|---|---|
| Nov 2026 | 1.32% |
| Oct 2026 | 1.30% |
| Sep 2026 | 1.23% |
| Aug 2026 | 1.18% |
| Jul 2026 | 1.14% |
| Jun 2026 | 1.08% |
| May 2026 | 1.06% |
| Apr 2026 | 1.03% |
| Mar 2026 | 1.07% |
| Feb 2026 | 1.12% |
| Jan 2026 | 1.15% |
| Dec 2025 | 1.19% |
| Nov 2025 | 1.25% |
| Oct 2025 | 1.32% |
| Sep 2025 | 1.46% |
| Aug 2025 | 1.56% |
| Jul 2025 | 1.86% |
| Jun 2025 | 2.06% |
| May 2025 | 2.27% |
| Apr 2025 | 2.40% |
| Mar 2025 | 2.55% |
| Feb 2025 | 2.73% |
| Jan 2025 | 2.90% |
| Dec 2024 | 3.08% |
| Nov 2024 | 3.21% |
| Oct 2024 | 3.39% |
| Sep 2024 | 3.49% |
| Aug 2024 | 3.57% |
| Jul 2024 | 3.64% |
| Jun 2024 | 3.63% |
| May 2024 | 3.66% |
| Apr 2024 | 3.65% |
| Mar 2024 | 3.68% |
| Feb 2024 | 3.64% |
| Jan 2024 | 3.66% |
| Dec 2023 | 3.70% |
| Nov 2023 | 3.75% |
| Oct 2023 | 3.75% |
| Sep 2023 | 3.70% |
| Aug 2023 | 3.70% |
| Jul 2023 | 3.68% |
| Jun 2023 | 3.65% |
| May 2023 | 3.61% |
| Apr 2023 | 3.61% |
| Mar 2023 | 3.58% |
| Feb 2023 | 3.23% |
| Jan 2023 | 3.12% |
Source: MAS. Data to 4 Nov 2026.
- 3-month compounded SORA (Singapore)
- US federal funds rate (effective)
Latest: SORA 1.32% (4 Nov 2026); Fed 3.88% (4 Nov 2026).
SORA is the benchmark for floating-rate home loans in Singapore. The US rate is shown for context: it moves SORA only indirectly, through the Singapore dollar and bank funding costs.
Table view
| Period | 3-month compounded SORA (Singapore) | US federal funds rate (effective) |
|---|---|---|
| Nov 2026 | 1.32% | 3.88% |
| Oct 2026 | 1.30% | 3.88% |
| Sep 2026 | 1.23% | 3.88% |
| Aug 2026 | 1.18% | 3.63% |
| Jul 2026 | 1.14% | 3.63% |
| Jun 2026 | 1.08% | 3.63% |
| May 2026 | 1.06% | 3.62% |
| Apr 2026 | 1.03% | 3.64% |
| Mar 2026 | 1.07% | 3.64% |
| Feb 2026 | 1.12% | 3.64% |
| Jan 2026 | 1.15% | 3.64% |
| Dec 2025 | 1.19% | 3.64% |
| Nov 2025 | 1.25% | 3.89% |
| Oct 2025 | 1.32% | 4.11% |
| Sep 2025 | 1.46% | 4.09% |
| Aug 2025 | 1.56% | 4.33% |
| Jul 2025 | 1.86% | 4.33% |
| Jun 2025 | 2.06% | 4.33% |
| May 2025 | 2.27% | 4.33% |
| Apr 2025 | 2.40% | 4.33% |
| Mar 2025 | 2.55% | 4.33% |
| Feb 2025 | 2.73% | 4.33% |
| Jan 2025 | 2.90% | 4.33% |
| Dec 2024 | 3.08% | 4.33% |
| Nov 2024 | 3.21% | 4.58% |
| Oct 2024 | 3.39% | 4.83% |
| Sep 2024 | 3.49% | 4.83% |
| Aug 2024 | 3.57% | 5.33% |
| Jul 2024 | 3.64% | 5.33% |
| Jun 2024 | 3.63% | 5.33% |
| May 2024 | 3.66% | 5.33% |
| Apr 2024 | 3.65% | 5.33% |
| Mar 2024 | 3.68% | 5.33% |
| Feb 2024 | 3.64% | 5.33% |
| Jan 2024 | 3.66% | 5.33% |
| Dec 2023 | 3.70% | 5.33% |
| Nov 2023 | 3.75% | 5.33% |
| Oct 2023 | 3.75% | 5.33% |
| Sep 2023 | 3.70% | 5.33% |
| Aug 2023 | 3.70% | 5.33% |
| Jul 2023 | 3.68% | 5.33% |
| Jun 2023 | 3.65% | 5.07% |
| May 2023 | 3.61% | 5.08% |
| Apr 2023 | 3.61% | 4.83% |
| Mar 2023 | 3.58% | 4.83% |
| Feb 2023 | 3.23% | 4.58% |
| Jan 2023 | 3.12% | 4.33% |
| Dec 2022 | 3.03% | 4.33% |
| Nov 2022 | 2.87% | 3.83% |
| Oct 2022 | 2.45% | 3.08% |
| Sep 2022 | 2.07% | 3.08% |
| Aug 2022 | 1.55% | 2.33% |
| Jul 2022 | 1.27% | 2.32% |
| Jun 2022 | 0.72% | 1.58% |
| May 2022 | 0.52% | 0.83% |
| Apr 2022 | 0.32% | 0.33% |
| Mar 2022 | 0.27% | 0.33% |
| Feb 2022 | 0.25% | 0.08% |
| Jan 2022 | 0.20% | 0.08% |
| Dec 2021 | 0.19% | 0.08% |
| Nov 2021 | 0.16% | 0.08% |
| Oct 2021 | 0.16% | 0.07% |
| Sep 2021 | 0.13% | 0.08% |
| Aug 2021 | 0.13% | 0.08% |
| Jul 2021 | 0.13% | 0.10% |
| Jun 2021 | 0.14% | 0.10% |
| May 2021 | 0.17% | 0.05% |
| Apr 2021 | 0.19% | 0.07% |
| Mar 2021 | 0.23% | 0.07% |
| Feb 2021 | 0.20% | 0.07% |
| Jan 2021 | 0.17% | 0.07% |
| Dec 2020 | 0.17% | 0.09% |
| Nov 2020 | 0.12% | 0.08% |
| Oct 2020 | 0.12% | 0.09% |
| Sep 2020 | 0.10% | 0.09% |
| Aug 2020 | 0.10% | 0.09% |
| Jul 2020 | 0.08% | 0.09% |
| Jun 2020 | 0.14% | 0.08% |
| May 2020 | 0.27% | 0.05% |
| Apr 2020 | 0.53% | 0.05% |
| Mar 2020 | 0.90% | 0.10% |
| Feb 2020 | 1.14% | 1.58% |
| Jan 2020 | 1.20% | 1.55% |
| Dec 2019 | 1.27% | 1.55% |
| Nov 2019 | 1.31% | 1.55% |
| Oct 2019 | 1.46% | 1.83% |
| Sep 2019 | 1.53% | 1.83% |
| Aug 2019 | 1.59% | 2.12% |
| Jul 2019 | 1.67% | 2.40% |
| Jun 2019 | 1.72% | 2.40% |
| May 2019 | 1.68% | 2.38% |
| Apr 2019 | 1.62% | 2.44% |
| Mar 2019 | 1.54% | 2.43% |
| Feb 2019 | 1.59% | 2.40% |
| Jan 2019 | 1.52% | 2.40% |
Source: MAS, FRED. Data to 4 Nov 2026.
How it compares with the US rate
The effective US federal funds rate was 3.88% on 4 Nov 2026, according to FRED.
A year earlier, on 1 October 2025, it was 4.09%. SORA is well below the US rate today. The chart shows how the two have moved since 2019.
That gap is a fact about the two rates.
What a change of this size means for a loan
A move of one percentage point in the benchmark moves the rate on a floating loan by one percentage point, if the bank’s spread stays the same.
Take a S$400,000 loan over 25 years. The standard instalment formula puts the difference at roughly S$200 a month (S$1,638 against S$1,835) between a 1.7% and a 2.7% rate. Your own loan will differ with its amount, tenure and terms.
Worked example, not an offer. It uses the standard instalment formula, equal monthly payments and the same bank spread throughout. Your loan will differ with its amount, tenure and terms.
For a loan with a fixed period, the benchmark matters only once the fixed period ends. Read the package terms for the date and the new spread.
What is behind the SORA level
Four forces shape SORA. The fourth is about your loan.
1. MAS steers the exchange rate, not an interest rate. The MAS policy framework says Singapore is a small, open economy. There, the exchange rate affects inflation more than interest rates do.
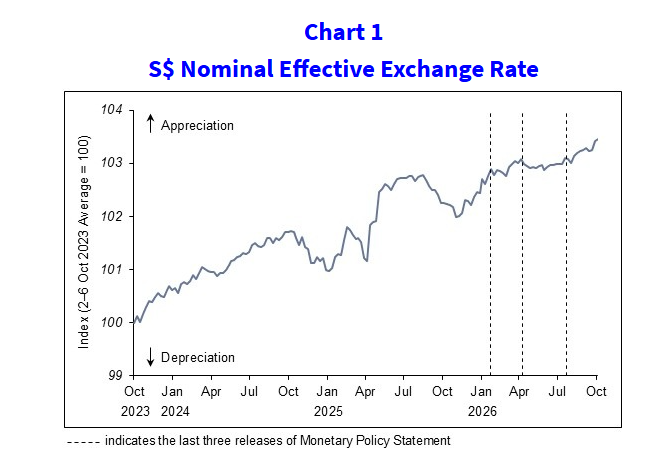
So MAS manages the S$NEER, the Singapore dollar against a basket of currencies, inside a band. MAS does not set a SORA target.
Its decision table shows two cuts to the slope of the band in January and April 2025.
It shows no change through January 2026, then small increases on 14 April and 27 July 2026.
On 14 October 2026 it made no change. This is a measured record. MAS gives no figure for the slope.
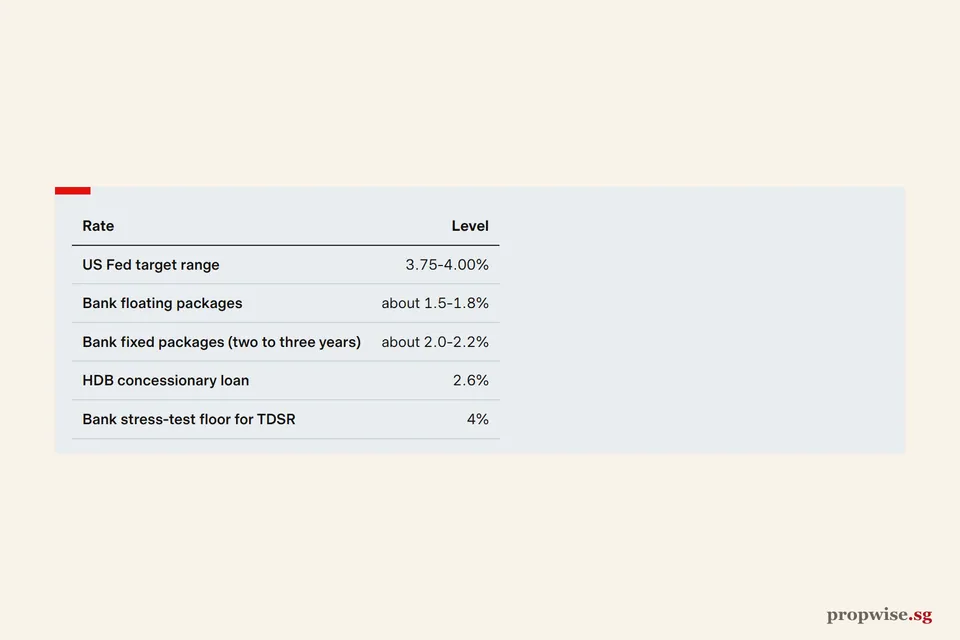
2. The US Fed sets the global price of money. On 16 September 2026 the Federal Open Market Committee raised its target range. The new range is 3.75% to 4.00%, by a 12-0 vote.
It said inflation remains elevated.
On 28 October 2026 the Committee held the range at 3.75% to 4.00%. Two members voted for a further quarter-point rise.
The effective US rate was 3.88% on 4 Nov 2026, against 1.32% for SORA. Singapore rates sit far below US rates.
SORA had already risen from about 1.02% in late April before the Fed moved (the MAS series).
3. Plenty of Singapore dollar cash holds short rates down. ING’s Deepali Bhargava wrote on 30 July 2025 that SORA had fallen largely because of ample domestic liquidity. She also wrote that a firm S$NEER was supported by strong foreign investment inflows.
4. For your loan, the bank’s spread comes on top. A floating package quotes a spread over SORA. So a change in SORA passes through to your rate one for one.
See the loan example above. A fixed period delays that.
The blog Dollars and Sense credits mainly the expected US rate cuts and safe-haven inflows for the fall, which is a different mix from ING’s.
The evidence is mixed. The Fed has since raised rates, so a view built on US cuts needs a fresh look.