MAS Holds Policy Steady: What It Means for SORA and Your Loan
MAS left the S$NEER band unchanged on 14 October 2026. It does not set SORA, so here is what the decision does and does not change for a home loan.
On 14 October 2026 the Monetary Authority of Singapore (MAS) left its policy unchanged: the slope, width and centre of the S$NEER band stay as they were. The 3-month compounded SORA, which many floating home loans follow, was 1.23% on 1 Oct 2026. MAS does not set that rate.
What MAS decided
MAS manages the Singapore dollar against a basket of currencies, not an interest rate. Its past decisions page lists the latest moves. “Unchanged” means MAS left that setting alone.
| Date | Slope of the band | Width | Centre |
|---|---|---|---|
| 14 Oct 2026 | Unchanged | Unchanged | Unchanged |
| 27 Jul 2026 | Increased very slightly | Unchanged | Unchanged |
| 14 Apr 2026 | Increased slightly | Unchanged | Unchanged |
| 29 Jan 2026 | Unchanged | Unchanged | Unchanged |
| 14 Oct 2025 | Unchanged | Unchanged | Unchanged |
Source: MAS, page updated 14 Oct 2026.
So this is a pause after two small steps up in 2026. MAS did not cut, and it did not tighten again.
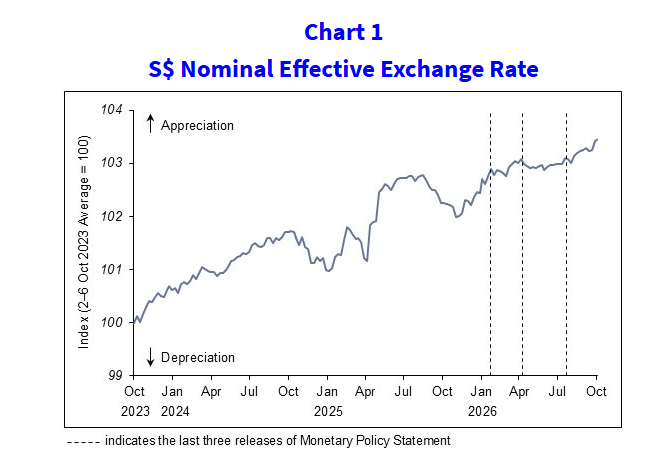
Source: MAS Monetary Policy Statement, 14 October 2026, Chart 1. Index, 2 to 6 October 2023 average = 100. A rise means a stronger S$.
The chart shows what the policy does. The S$NEER is an index of the Singapore dollar against its trading partners. It has risen from 100 in October 2023 to about 103.4 now, so the Singapore dollar has gained roughly 3% on that basket in three years. A stronger currency makes imports cheaper, which pulls down inflation. That is why MAS uses the exchange rate, not an interest rate, as its main tool.
The numbers behind the decision
MAS based its decision on growth and inflation. These are the figures in its 14 October statement, with what each one means.
| Measure | Latest reading | Earlier reading |
|---|---|---|
| GDP, third quarter 2026, year on year (advance estimate) | 5.4% | 5.9% in Q2 2026 (SingStat) |
| GDP, third quarter 2026, quarter on quarter, seasonally adjusted | 1.1% | Slightly faster in the second quarter |
| MAS Core Inflation, July to August 2026 | 2.1% | 1.5% in the second quarter |
| Food inflation, July to August 2026 | 2.2% | 1.9% in the second quarter |
| Headline CPI-All Items, Aug 2026, year on year | 2.3% | SingStat consumer price index |
Source: MAS statement, 14 October 2026; SingStat for the earlier GDP reading and the CPI figure. The advance GDP estimate is the first estimate and can change.
What the growth figures mean. An economy that grows 5.4% in a year is running hot for a mature economy. MAS says the output gap is positive: the economy is producing more than its normal capacity. A positive gap pushes wages and prices up. The 1.1% quarterly gain is slower than the previous quarter, which fits MAS’s view that growth will move down from an exceptionally strong, AI-driven pace.
What the inflation figures mean. MAS Core Inflation strips out accommodation and private transport costs, which swing widely. At 2.1% it is up from 1.5% in the second quarter, so price pressure has built. Food rose from 1.9% to 2.2%. MAS says services inflation came in lower than it projected. The central bank says imported costs, driven by higher commodity prices, are behind the rise, and that is the part a stronger currency can offset.
Why MAS held
MAS says the S$NEER has strengthened modestly in the upper half of the band. It judges that the current slope lets the currency keep firming, which should offset a near-term rise in imported inflation and ease price pressure through 2027. It also says it can respond if medium-term price stability is at risk.
MAS gives these forecasts, as at 14 October 2026:
| 2026 | 2027 | |
|---|---|---|
| MAS Core Inflation | 1.5% to 2.0% | 1.5% to 2.5% |
| Headline (CPI-All Items) inflation | About 2.0% | 1.5% to 2.5% |
Read the forecast as a range. Core inflation has already reached 2.1% in July and August, above the 2026 range, so the full-year average of 1.5% to 2.0% implies the rest of the year runs near the top of the range or that earlier months were low. The 2027 range is wider at the top (2.5%), which tells you MAS sees more room for prices to rise than to fall.
MAS puts the risks to inflation to the upside, for example higher energy or food prices, or faster wage costs if AI-related spending spreads through the economy. It says higher-than-expected interest rates or a sharper pullback in AI investment could weigh on growth. For full-year growth, MAS gave no 2026 or 2027 forecast in the statement; the Ministry of Trade and Industry updates its forecast in November.
What analysts make of it
DBS Group Research, led by Chua Han Teng, links the pause to lower-than-expected inflation in 2026 and to expected easing of price pressure from mid-2027. It also notes that strong third-quarter growth should narrow the positive output gap, which limits inflation. This is one bank’s reading. We did not find an official source for the weight MAS gave to each factor.
What it means for SORA and home loans
The decision does not set your loan rate. SORA is a market rate, and a floating package adds the bank’s spread on top of it. Here is where SORA and the US rate stand.
Latest: SORA 1.23% (1 Oct 2026).
SORA is the benchmark for floating-rate home loans in Singapore. Your bank adds its own spread.
Table view
| Period | 3-month compounded SORA |
|---|---|
| Oct 2026 | 1.23% |
| Sep 2026 | 1.23% |
| Aug 2026 | 1.18% |
| Jul 2026 | 1.14% |
| Jun 2026 | 1.08% |
| May 2026 | 1.06% |
| Apr 2026 | 1.03% |
| Mar 2026 | 1.07% |
| Feb 2026 | 1.12% |
| Jan 2026 | 1.15% |
| Dec 2025 | 1.19% |
| Nov 2025 | 1.25% |
| Oct 2025 | 1.32% |
| Sep 2025 | 1.46% |
| Aug 2025 | 1.56% |
| Jul 2025 | 1.86% |
| Jun 2025 | 2.06% |
| May 2025 | 2.27% |
| Apr 2025 | 2.40% |
| Mar 2025 | 2.55% |
| Feb 2025 | 2.73% |
| Jan 2025 | 2.90% |
| Dec 2024 | 3.08% |
| Nov 2024 | 3.21% |
| Oct 2024 | 3.39% |
| Sep 2024 | 3.49% |
| Aug 2024 | 3.57% |
| Jul 2024 | 3.64% |
| Jun 2024 | 3.63% |
| May 2024 | 3.66% |
| Apr 2024 | 3.65% |
| Mar 2024 | 3.68% |
| Feb 2024 | 3.64% |
| Jan 2024 | 3.66% |
| Dec 2023 | 3.70% |
| Nov 2023 | 3.75% |
| Oct 2023 | 3.75% |
| Sep 2023 | 3.70% |
| Aug 2023 | 3.70% |
| Jul 2023 | 3.68% |
| Jun 2023 | 3.65% |
| May 2023 | 3.61% |
| Apr 2023 | 3.61% |
| Mar 2023 | 3.58% |
| Feb 2023 | 3.23% |
| Jan 2023 | 3.12% |
Source: MAS. Data to 1 Oct 2026.
The effective US federal funds rate was 3.88% on 1 Oct 2026. Singapore rates are well below US rates.
A hold gives no promise about where SORA goes next. The 3-month rate moved +0.04 pp between 1 Sep 2026 and 1 Oct 2026. This decision alone cannot say whether it rises or falls.
If you hold a floating loan, the size of any change matters more than its cause. A one percentage point move in SORA changes the rate by one point if the spread stays the same.
Worked example, not an offer. Propwise calculation with the standard instalment formula, equal monthly payments and the same bank spread throughout. Your loan will differ with its amount, tenure and terms.
If your loan has a fixed period, SORA matters only once that period ends. Check the date and the new spread in your package terms. Our guide to choosing between a bank loan and an HDB loan sets out the trade-offs.
The dashboard today
| Indicator | Latest | Change | Trend |
|---|---|---|---|
| URA private price index1Q2009 = 100 | 219.4 (Q2 2026) | +1.4% q/q in the Q3 2026 flash estimate; +2.9% y/y to Q2 2026 | Q3 2020 – Q2 2026 |
| Landed homes | 258.4 (Q2 2026) | +2.8% q/q in the Q3 2026 flash estimate | Q3 2020 – Q2 2026 |
| Non-landed: CCR / RCR / OCRTrend line: all non-landed homes | 161.5 / 226.2 / 271.1 | -0.1% / +0.2% / +2.2% q/q in the Q3 2026 flash estimate | Q3 2020 – Q2 2026 |
| New private home sales in the monthFrom developers, excluding ECs. Launch months swing a lot | 153 (Aug 2026) | -92.9% y/y | Sep 2023 – Aug 2026 |
| Private resales in the monthCaveats, excluding ECs | 1,147 (Aug 2026) | -12.4% y/y | Sep 2023 – Aug 2026 |
| HDB resale price index1Q2009 = 100 | 202.4 (Q3 2026 flash estimate) | -0.2% q/q; -0.6% y/y | Q4 2020 – Q3 2026 |
| HDB resale transactions in the month | 2,246 (Sep 2026) | +3.3% y/y | Oct 2023 – Sep 2026 |
| HDB resales at S$1 million or more in the month | 208 (Sep 2026) | +20.9% y/y | Oct 2023 – Sep 2026 |
| Private home vacancy rate | 6.4% (Q2 2026) | +0.2 pp on the quarter before | Q3 2020 – Q2 2026 |
| 3-month compounded SORA | 1.23% (1 Oct 2026) | +0.04 pp since 1 Sep 2026 | Oct 2024 – Oct 2026 |
| Bank home-loan packagesLate Sep to early Oct 2026 | Floating about 1.5–1.8%, fixed about 2.0–2.2% | Up after the 16 Sep US rate hike |
Source: URA, HDB, HDB resale transactions, MAS (SORA), The Business Times, 2 Oct 2026 (loan packages), CNA, 18 Sep 2026 (loan packages). Index levels and changes are from the official series; sales counts and HDB medians are Propwise calculations from URA and HDB transaction data. Provisional (flash) figures are labelled as such. Each trend line shows the period written under it, scaled to its own range; the dot is the latest value.
What this does not tell you
- It does not forecast SORA. MAS steers the exchange rate. This decision says nothing on the path of SORA, and we do not forecast it.
- It is not your rate. Your bank sets its own spread. Some packages use the 1-month or 6-month rate, or a fixed rate.
- We read the statement through a summary tool. The reasons, forecasts and risks above come from the MAS statement page. Read the full statement before you rely on a figure.
- It does not show a link to property prices. This article does not show that the decision will raise or lower prices.