Singapore's Private Home Vacancy Rate: The Five-Year Range by Region
Vacancy of completed private homes, island-wide and by CCR, RCR and OCR, with the five-year range, how the rate is counted and what it cannot show.
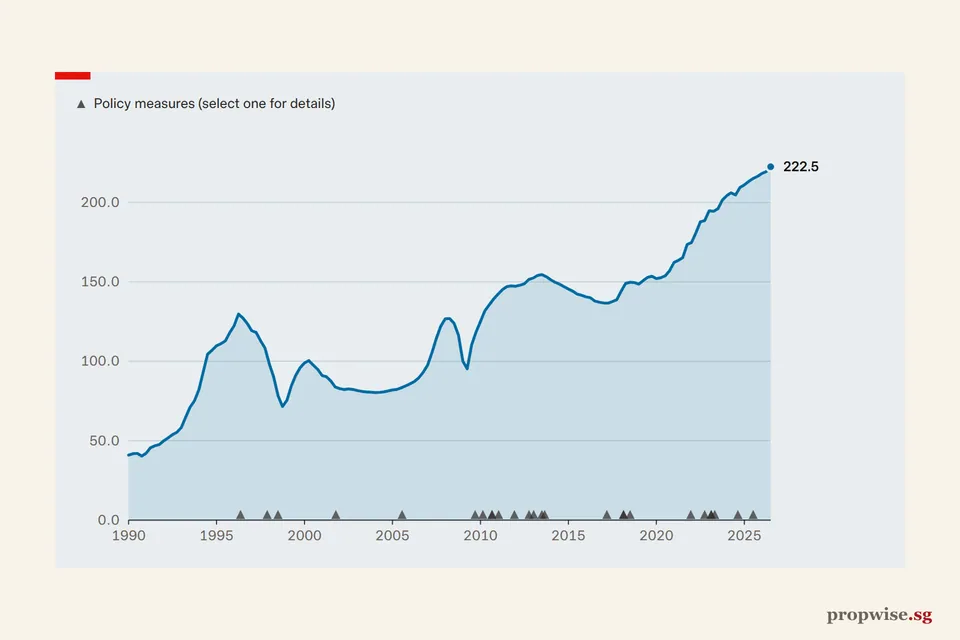
7.2% of completed private homes in Singapore were vacant at the end of Q3 2026, excluding executive condominiums (ECs). In the five years from Q3 2021 to Q2 2026, the island-wide rate moved between 5.3% and 8.4%, so the latest reading sits inside that range.
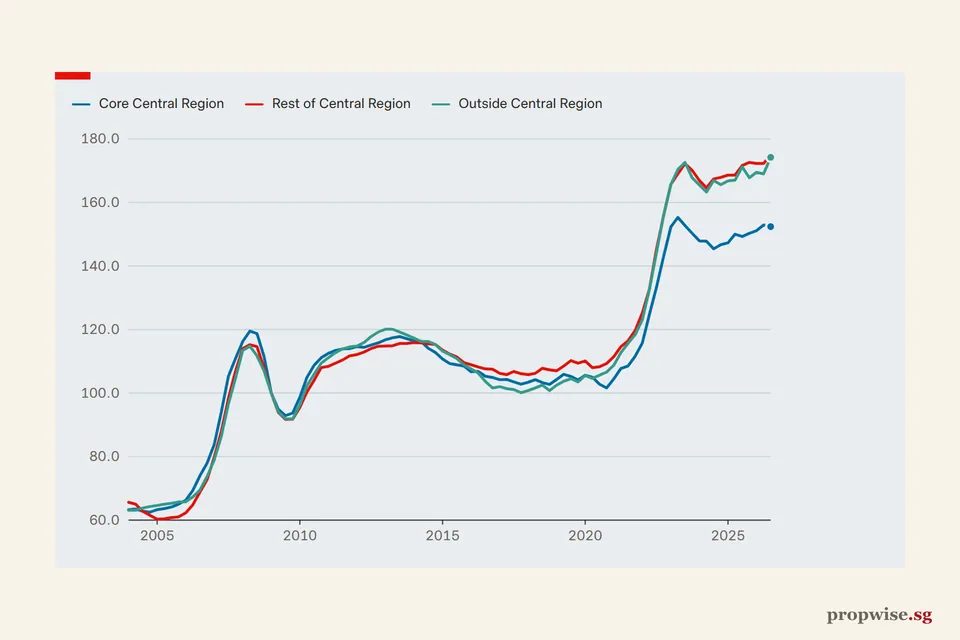
The three regions sit at very different levels. At the end of Q2 2026, the latest quarter with a regional split, the rate was 8.3% in the Core Central Region (CCR).
It was 6.1% in the Rest of Central Region (RCR) and 5.6% in the Outside Central Region (OCR).
URA published the latest figures on 23 Oct 2026.
Latest: Vacancy 7.2% (Q3 2026), up 0.3 percentage points on Q3 2025.
Vacancy is calculated as vacant units divided by units available, using URA counts of completed private homes (landed and non-landed).
Table view
| Period | Private homes vacant (%) |
|---|---|
| Q3 2026 | 7.2% |
| Q2 2026 | 6.4% |
| Q1 2026 | 6.2% |
| Q4 2025 | 6.0% |
| Q3 2025 | 6.9% |
| Q2 2025 | 7.1% |
| Q1 2025 | 6.5% |
| Q4 2024 | 6.6% |
| Q3 2024 | 7.2% |
| Q2 2024 | 6.1% |
| Q1 2024 | 6.8% |
| Q4 2023 | 8.1% |
| Q3 2023 | 8.4% |
| Q2 2023 | 6.3% |
| Q1 2023 | 6.0% |
| Q4 2022 | 5.5% |
| Q3 2022 | 5.7% |
| Q2 2022 | 5.4% |
| Q1 2022 | 5.3% |
| Q4 2021 | 6.0% |
| Q3 2021 | 6.4% |
| Q2 2021 | 6.3% |
| Q1 2021 | 6.4% |
| Q4 2020 | 7.0% |
| Q3 2020 | 6.2% |
| Q2 2020 | 5.4% |
| Q1 2020 | 5.4% |
| Q4 2019 | 5.5% |
| Q3 2019 | 6.1% |
| Q2 2019 | 6.4% |
| Q1 2019 | 6.3% |
| Q4 2018 | 6.4% |
| Q3 2018 | 6.8% |
| Q2 2018 | 7.1% |
| Q1 2018 | 7.4% |
| Q4 2017 | 7.8% |
| Q3 2017 | 8.4% |
| Q2 2017 | 8.1% |
| Q1 2017 | 8.1% |
| Q4 2016 | 8.4% |
| Q3 2016 | 8.7% |
| Q2 2016 | 8.9% |
| Q1 2016 | 7.5% |
| Q4 2015 | 8.1% |
| Q3 2015 | 7.8% |
| Q2 2015 | 7.9% |
| Q1 2015 | 7.2% |
| Q4 2014 | 7.8% |
| Q3 2014 | 7.1% |
| Q2 2014 | 7.1% |
| Q1 2014 | 6.6% |
| Q4 2013 | 6.2% |
| Q3 2013 | 6.1% |
| Q2 2013 | 5.6% |
| Q1 2013 | 5.2% |
| Q4 2012 | 5.4% |
| Q3 2012 | 6.1% |
| Q2 2012 | 5.9% |
| Q1 2012 | 6.0% |
| Q4 2011 | 5.9% |
| Q3 2011 | 5.8% |
| Q2 2011 | 5.1% |
| Q1 2011 | 4.9% |
| Q4 2010 | 5.0% |
| Q3 2010 | 5.2% |
| Q2 2010 | 5.4% |
| Q1 2010 | 4.6% |
| Q4 2009 | 5.0% |
| Q3 2009 | 6.2% |
| Q2 2009 | 5.9% |
| Q1 2009 | 5.9% |
| Q4 2008 | 6.1% |
| Q3 2008 | 5.8% |
| Q2 2008 | 6.1% |
| Q1 2008 | 6.3% |
| Q4 2007 | 5.6% |
| Q3 2007 | 5.4% |
| Q2 2007 | 4.9% |
| Q1 2007 | 5.1% |
| Q4 2006 | 6.1% |
| Q3 2006 | 6.6% |
| Q2 2006 | 6.5% |
| Q1 2006 | 7.4% |
| Q4 2005 | 8.4% |
| Q3 2005 | 8.5% |
| Q2 2005 | 8.7% |
| Q1 2005 | 8.8% |
| Q4 2004 | 8.1% |
| Q3 2004 | 8.5% |
| Q2 2004 | 8.3% |
| Q1 2004 | 8.4% |
| Q4 2003 | 7.7% |
| Q3 2003 | 8.1% |
| Q2 2003 | 7.6% |
| Q1 2003 | 7.6% |
| Q4 2002 | 8.5% |
| Q3 2002 | 8.1% |
| Q2 2002 | 8.3% |
| Q1 2002 | 7.6% |
| Q4 2001 | 8.2% |
| Q3 2001 | 7.6% |
| Q2 2001 | 7.1% |
| Q1 2001 | 6.5% |
| Q4 2000 | 6.9% |
| Q3 2000 | 7.9% |
| Q2 2000 | 9.1% |
| Q1 2000 | 8.5% |
Source: URA. Data to Q3 2026.
How the rate is counted
The island-wide rate is vacant units divided by units available. Both counts come from SingStat table M400841, from URA: “Available and Vacant Private Residential Properties (End of Period), Quarterly”.
The table gives counts only. We divide the two counts ourselves.
Counts: URA, via SingStat table M400841. The table gives counts only. Covers completed private homes (with a Temporary Occupation Permit or Certificate of Statutory Completion), not HDB flats or ECs.
The table’s footnote says the data cover all completed private residential units. That means units with a Temporary Occupation Permit or a Certificate of Statutory Completion. It excludes hostels, HDB flats, tenement houses, parsonages and ECs.
In Q2 2026 there were 424,581 units available and 26,961 vacant, which gives 6.35% (final, as at 24 July 2026). URA’s release for that quarter gave the rate as 6.4%.
The island-wide release says the rate excludes ECs.
The five-year range, by region
Here are the lowest and highest quarterly readings from Q3 2021 to Q2 2026, 20 quarters in all.
Island-wide figures are final. Regional figures are as stated in URA’s releases.
| Area | Lowest | Highest | Average of 20 quarters |
|---|---|---|---|
| Island | 5.3% (Q1 2022) | 8.4% (Q3 2023) | 6.4% |
| CCR | 6.9% (Q4 2022) | 11.2% (Q3 2024) | 9.0% |
| RCR | 5.8% (Q2 2024) | 9.3% (Q3 2023) | 7.1% |
| OCR | 3.3% (Q1 2023) | 7.4% (Q4 2023) | 4.9% |
- Core Central Region
- Rest of Central Region
- Outside Central Region
- Island-wide
Latest: CCR 8.3% (Q2 2026), down 2.4 percentage points on Q2 2025; RCR 6.1% (Q2 2026), down 1.1 percentage points on Q2 2025; OCR 5.6% (Q2 2026), unchanged on Q2 2025; Island 7.2% (Q3 2026), up 0.3 percentage points on Q3 2025.
Island-wide rate: vacant units divided by units available, excluding ECs. Regional rates are as stated in the URA releases.
Table view
| Period | Core Central Region | Rest of Central Region | Outside Central Region | Island-wide |
|---|---|---|---|---|
| Q3 2026 | – | – | – | 7.2% |
| Q2 2026 | 8.3% | 6.1% | 5.6% | 6.4% |
| Q1 2026 | 8.2% | 6.3% | 5.2% | 6.2% |
| Q4 2025 | 8.8% | 6.0% | 4.9% | 6.0% |
| Q3 2025 | 9.9% | 6.7% | 5.6% | 6.9% |
| Q2 2025 | 10.7% | 7.2% | 5.6% | 7.1% |
| Q1 2025 | 10.3% | 6.6% | 4.7% | 6.5% |
| Q4 2024 | 10.0% | 7.3% | 4.7% | 6.6% |
| Q3 2024 | 11.2% | 8.1% | 4.9% | 7.2% |
| Q2 2024 | 9.3% | 5.8% | 4.9% | 6.1% |
| Q1 2024 | 8.9% | 6.6% | 6.0% | 6.8% |
| Q4 2023 | 9.8% | 8.1% | 7.4% | 8.1% |
| Q3 2023 | 10.0% | 9.3% | 7.3% | 8.4% |
| Q2 2023 | 7.9% | 7.9% | 4.6% | 6.3% |
| Q1 2023 | 7.7% | 9.2% | 3.3% | 6.0% |
| Q4 2022 | 6.9% | 7.9% | 3.6% | 5.5% |
| Q3 2022 | 7.3% | 7.3% | 4.0% | 5.7% |
| Q2 2022 | 7.4% | 6.6% | 3.8% | 5.4% |
| Q1 2022 | 8.1% | 6.1% | 3.6% | 5.3% |
| Q4 2021 | 9.3% | 7.0% | 4.1% | 6.0% |
| Q3 2021 | 9.7% | 6.5% | 4.8% | 6.4% |
| Q2 2021 | 9.6% | 5.6% | 5.2% | 6.3% |
| Q1 2021 | 9.5% | 6.1% | 5.3% | 6.4% |
| Q4 2020 | 11.0% | 7.3% | 5.1% | 7.0% |
Source: URA. Data to Q3 2026.
Two things stand out. First, the CCR’s lowest reading, 6.9%, was higher than the OCR’s average, 4.9%. In vacancy terms, the CCR’s best day is still roomier than the OCR’s typical one.
Second, the regions did not move together at every turn. The CCR peaked in Q3 2024, while the RCR and OCR peaked about a year earlier, in Q3 and Q4 2023.
The island-wide jump in Q3 2023 is the largest in the window. The rate went from 6.3% in Q2 2023 to 8.4% in Q3 2023, then fell to 6.8% by Q1 2024.
In Q3 2023, vacant units rose by 9,289 (25,052 to 34,341) while available units rose by 8,374 (398,289 to 406,663).
When URA publishes
URA publishes its full quarterly statistics on the fourth Friday of January, April, July and October. The Q3 2026 figures came out on Friday 23 October 2026. The five-year range above is as at Q2 2026.
For how vacancy, rents and prices have moved together in past cycles, see our guide on why demand and supply matter. If you let out a home, see how to rent a home in Singapore and how to read rental yield.
What is behind the swings in vacancy
1. Waves of new completions.
The island-wide jump in Q3 2023 came with the largest completion batch in decades. Savills counted 8,517 new homes, the most in a quarter since Q1 2000. They included Treasure at Tampines (2,203 units) and Normanton Park (1,862).
Savills said new supply far outpaced net demand that quarter. Supply has been calmer since.
Savills reported that stock grew by only 416 units in Q2 2026, the smallest rise in four quarters. Even so, the rate still edged up.
2. New homes sit empty before anyone moves in. In Q2 2026 almost 90% of the rise in vacant units, 721 of 803, was landed. Savills called part of that likely transitional, a lag after projects such as Pollen Collection and Belgravia Ace completed.
It also said the rise could point to softer leasing demand for landed homes. The evidence is mixed.
3. Tenant demand. Savills reported that leasing transactions rose 5.1% on the quarter and 3% on the year in Q2 2026. It said senior expatriate executives from North Asia, outside China, lifted demand for homes renting above S$10,000 a month.
It also warned that weaker corporate expansion and expatriate inflows could temper demand.
Rent growth is low, as our guide to yearly rent changes shows. Savills keeps its forecast of broadly flat private rents in 2026.
4. Rules that shape foreign demand are changing. EdgeProp reported that Budget 2026 lifts the Employment Pass minimum qualifying salary. It goes from S$5,600 to S$6,000 a month for new applications from 1 January 2027.
Huttons’ Mark Yip said rents could fall by up to 3% in 2027 and 2028 if demand does not keep pace with supply. ERA’s Marcus Chu expects a gradual effect. OCBC’s Selena Ling expects a muted one.
This is a forecast, and the analysts disagree.
Supply still to come. URA’s pipeline table shows 51,677 non-landed units not yet completed at Q2 2026, up from 47,358 at Q4 2025.