What Drives Singapore Property Prices? Demand, Supply, Vacancy
Prices follow rents, and rents follow vacancy. The three official numbers that show whether Singapore's demand is outrunning supply, tested on 2005–2025 data.
Over time, Singapore property prices follow rents, and rents follow one thing: whether new homes arrive faster than new households. You can track this yourself with three free official numbers. Data from 2005 to 2025 shows the pattern working in the 2007 boom and the 2014–16 slump, and it also shows where the pattern breaks.
This article covers the method. For today’s prices, rates and forecasts, read our 2026 market outlook.
At a glance
- Track three numbers: net new private homes, the vacancy rate and the rental index. All three are public.
- 2006–07: only about 5,500 net new private homes arrived while the population grew by about 323,000. Rents rose 61% in two years.
- 2014–16: about 58,700 net new homes arrived against 208,000 more people. Vacancy hit 8.4% and rents fell 11%.
- 2022–23: vacancy rose to 8.1%, yet rents still rose, because the population jumped. Never read one number alone.
- Sales volume is not demand. URA says Q3 2026 sales volume fell about 30% on the quarter while its price index rose 1.4%.
Two kinds of demand
“Demand” means two things. Transaction demand is how many people want to buy. It swings with sentiment, interest rates and cooling measures. Physical demand is how many households need somewhere to live. Rents measure physical demand, because a tenant has to live somewhere whatever the mood of the market.
Supply is easier to know than demand. URA publishes the private pipeline by expected year of completion, so you can see most of the new homes that are coming. Nobody publishes next year’s household growth.
The three numbers
| Number | What it tells you | Latest (Q2 2026) |
|---|---|---|
| Net new private homes | Change in the stock of completed private homes (excludes ECs and HDB flats). Demolitions after en bloc sales subtract. | 424,581 homes, up 1,229 on Q4 2025 |
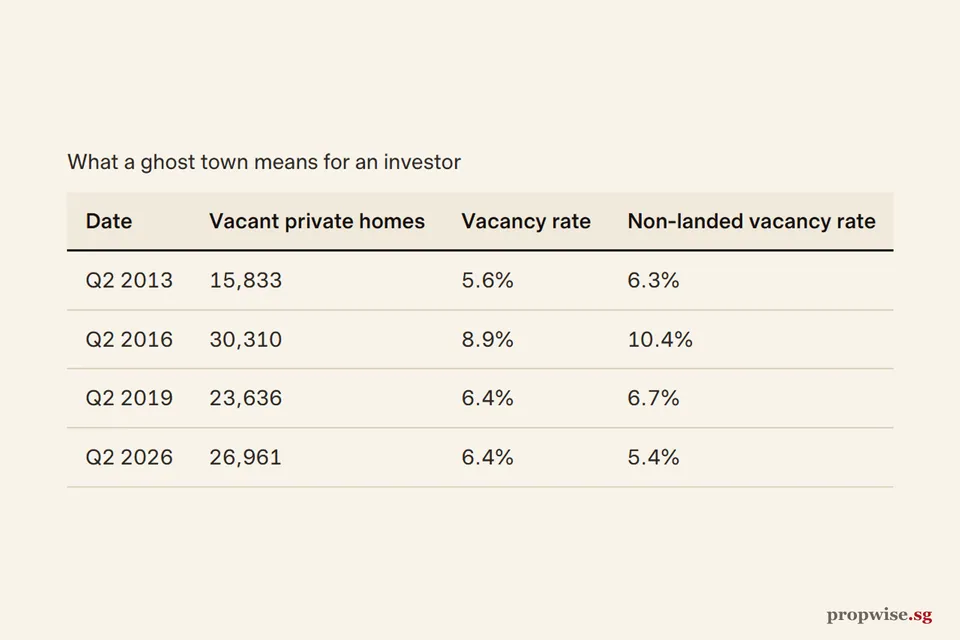
| Vacancy rate | Vacant homes divided by all completed homes (same dataset) | 6.35% (26,961 vacant) |
| Rental index | URA’s private residential rental index, 1Q2009 = 100 | 162.5, about 1.2% below its Q3 2023 peak of 164.5 |
Since 2005, the quarterly vacancy rate has ranged from 4.6% (Q1 2010) to 8.9% (Q2 2016). Today’s 6.35% sits in the middle of that range.
Latest: Vacancy 6.4% (Q2 2026).
Vacancy is calculated as vacant units divided by units available, using URA counts of completed private homes (landed and non-landed).
Table view
| Period | Private homes vacant (%) |
|---|---|
| Q2 2026 | 6.4% |
| Q1 2026 | 6.2% |
| Q4 2025 | 6.0% |
| Q3 2025 | 6.9% |
| Q2 2025 | 7.1% |
| Q1 2025 | 6.5% |
| Q4 2024 | 6.6% |
| Q3 2024 | 7.2% |
| Q2 2024 | 6.1% |
| Q1 2024 | 6.8% |
| Q4 2023 | 8.1% |
| Q3 2023 | 8.4% |
| Q2 2023 | 6.3% |
| Q1 2023 | 6.0% |
| Q4 2022 | 5.5% |
| Q3 2022 | 5.7% |
| Q2 2022 | 5.4% |
| Q1 2022 | 5.3% |
| Q4 2021 | 6.0% |
| Q3 2021 | 6.4% |
| Q2 2021 | 6.3% |
| Q1 2021 | 6.4% |
| Q4 2020 | 7.0% |
| Q3 2020 | 6.2% |
| Q2 2020 | 5.4% |
| Q1 2020 | 5.4% |
| Q4 2019 | 5.5% |
| Q3 2019 | 6.1% |
| Q2 2019 | 6.4% |
| Q1 2019 | 6.3% |
| Q4 2018 | 6.4% |
| Q3 2018 | 6.8% |
| Q2 2018 | 7.1% |
| Q1 2018 | 7.4% |
| Q4 2017 | 7.8% |
| Q3 2017 | 8.4% |
| Q2 2017 | 8.1% |
| Q1 2017 | 8.1% |
| Q4 2016 | 8.4% |
| Q3 2016 | 8.7% |
| Q2 2016 | 8.9% |
| Q1 2016 | 7.5% |
| Q4 2015 | 8.1% |
| Q3 2015 | 7.8% |
| Q2 2015 | 7.9% |
| Q1 2015 | 7.2% |
| Q4 2014 | 7.8% |
| Q3 2014 | 7.1% |
| Q2 2014 | 7.1% |
| Q1 2014 | 6.6% |
| Q4 2013 | 6.2% |
| Q3 2013 | 6.1% |
| Q2 2013 | 5.6% |
| Q1 2013 | 5.2% |
| Q4 2012 | 5.4% |
| Q3 2012 | 6.1% |
| Q2 2012 | 5.9% |
| Q1 2012 | 6.0% |
| Q4 2011 | 5.9% |
| Q3 2011 | 5.8% |
| Q2 2011 | 5.1% |
| Q1 2011 | 4.9% |
| Q4 2010 | 5.0% |
| Q3 2010 | 5.2% |
| Q2 2010 | 5.4% |
| Q1 2010 | 4.6% |
| Q4 2009 | 5.0% |
| Q3 2009 | 6.2% |
| Q2 2009 | 5.9% |
| Q1 2009 | 5.9% |
| Q4 2008 | 6.1% |
| Q3 2008 | 5.8% |
| Q2 2008 | 6.1% |
| Q1 2008 | 6.3% |
| Q4 2007 | 5.6% |
| Q3 2007 | 5.4% |
| Q2 2007 | 4.9% |
| Q1 2007 | 5.1% |
| Q4 2006 | 6.1% |
| Q3 2006 | 6.6% |
| Q2 2006 | 6.5% |
| Q1 2006 | 7.4% |
| Q4 2005 | 8.4% |
| Q3 2005 | 8.5% |
| Q2 2005 | 8.7% |
| Q1 2005 | 8.8% |
| Q4 2004 | 8.1% |
| Q3 2004 | 8.5% |
| Q2 2004 | 8.3% |
| Q1 2004 | 8.4% |
| Q4 2003 | 7.7% |
| Q3 2003 | 8.1% |
| Q2 2003 | 7.6% |
| Q1 2003 | 7.6% |
| Q4 2002 | 8.5% |
| Q3 2002 | 8.1% |
| Q2 2002 | 8.3% |
| Q1 2002 | 7.6% |
| Q4 2001 | 8.2% |
| Q3 2001 | 7.6% |
| Q2 2001 | 7.1% |
| Q1 2001 | 6.5% |
| Q4 2000 | 6.9% |
| Q3 2000 | 7.9% |
| Q2 2000 | 9.1% |
| Q1 2000 | 8.5% |
Source: URA. Data to Q2 2026.
Three episodes, tested
The table compares net new homes with the change in Singapore’s total population, which includes non-residents. The last two columns show the change in URA’s rental and price indices, fourth quarter to fourth quarter.
| Period | Net new private homes | Population change | Vacancy at period end | Rents | Prices |
|---|---|---|---|---|---|
| 2006–07 | 5,456 | +322,837 | 5.6% (8.4% at end-2005) | +61.2% | +44.5% |
| 2014–16 | 58,710 | +208,121 | 8.4% (6.2% at end-2013) | −11.1% | −10.4% |
| 2022–23 | 28,393 | +464,082 | 8.1% (6.0% at end-2021) | +41.0% | +16.1% |
2006–07 is the tight-supply case. Vacancy fell, rents soared and prices followed. But tight supply does not protect against a demand shock. The price index then fell 24.9% between Q2 2008 and Q2 2009, when the global financial crisis hit.
2014–16 is the supply-wave case. Net additions ran at about 19,600 homes a year, vacancy climbed, and rents and prices fell together. Other forces were also at work in those years, so supply was not the only cause.
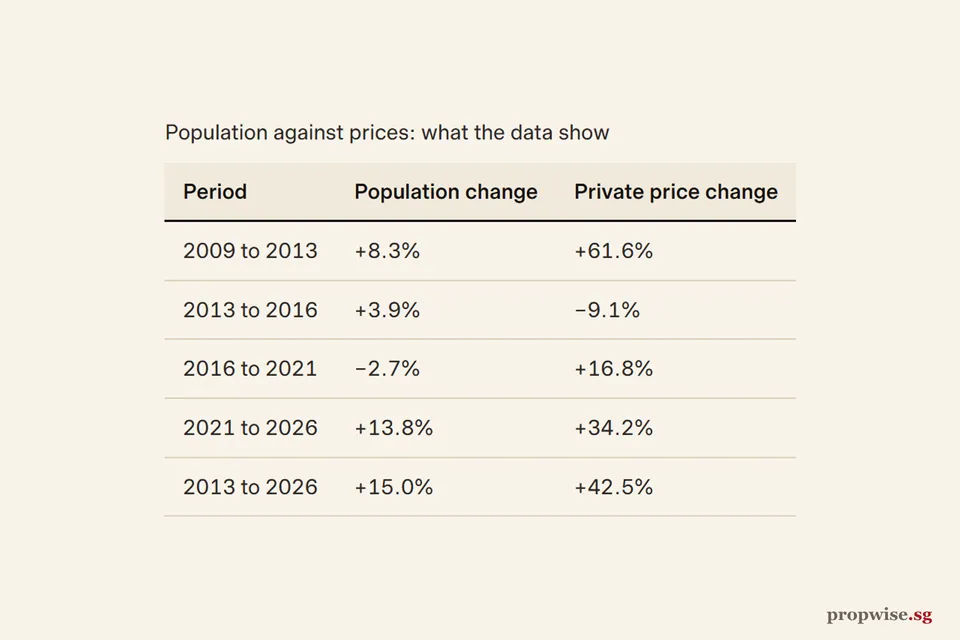
2022–23 is the warning. Net additions rose and vacancy reached 8.1%, yet rents rose 41%. The population grew by 464,082, and about 302,000 of that was non-residents. Demand jumped faster than supply, even with more empty homes. In 2020–21 the same swing ran the other way: total population fell by about 250,000.
The lesson: supply is the more predictable side, but a jump or fall in headcount can overpower it. Watch all three numbers and the direction they move together.
- Prices (URA price index)
- Rents (URA rental index)
Latest: Prices 219.4 (Q2 2026); Rents 162.5 (Q2 2026).
Table view
| Period | Prices (URA price index) | Rents (URA rental index) |
|---|---|---|
| Q2 2026 | 219.4 | 162.5 |
| Q1 2026 | 218.3 | 161.4 |
| Q4 2025 | 216.4 | 160.9 |
| Q3 2025 | 215.1 | 161.7 |
| Q2 2025 | 213.2 | 159.8 |
| Q1 2025 | 211.1 | 158.5 |
| Q4 2024 | 209.4 | 157.9 |
| Q3 2024 | 204.7 | 157.9 |
| Q2 2024 | 206.1 | 156.6 |
| Q1 2024 | 204.3 | 157.9 |
| Q4 2023 | 201.5 | 161.0 |
| Q3 2023 | 196.0 | 164.5 |
| Q2 2023 | 194.4 | 163.2 |
| Q1 2023 | 194.8 | 158.8 |
| Q4 2022 | 188.6 | 148.1 |
| Q3 2022 | 187.8 | 137.9 |
| Q2 2022 | 180.9 | 127.0 |
| Q1 2022 | 174.8 | 119.0 |
| Q4 2021 | 173.6 | 114.2 |
| Q3 2021 | 165.3 | 111.3 |
| Q2 2021 | 163.5 | 109.3 |
| Q1 2021 | 162.2 | 106.2 |
| Q4 2020 | 157.0 | 103.9 |
| Q3 2020 | 153.8 | 103.8 |
| Q2 2020 | 152.6 | 104.3 |
| Q1 2020 | 152.1 | 105.6 |
| Q4 2019 | 153.6 | 104.5 |
| Q3 2019 | 152.8 | 105.6 |
| Q2 2019 | 150.8 | 105.5 |
| Q1 2019 | 148.6 | 104.1 |
| Q4 2018 | 149.6 | 103.1 |
| Q3 2018 | 149.7 | 104.1 |
| Q2 2018 | 149.0 | 103.8 |
| Q1 2018 | 144.1 | 102.8 |
| Q4 2017 | 138.7 | 102.5 |
| Q3 2017 | 137.6 | 103.4 |
| Q2 2017 | 136.6 | 103.4 |
| Q1 2017 | 136.7 | 103.6 |
| Q4 2016 | 137.2 | 104.5 |
| Q3 2016 | 137.9 | 105.6 |
| Q2 2016 | 140.0 | 106.9 |
| Q1 2016 | 140.6 | 107.5 |
| Q4 2015 | 141.6 | 108.9 |
| Q3 2015 | 142.3 | 110.3 |
| Q2 2015 | 144.2 | 111.0 |
| Q1 2015 | 145.5 | 112.2 |
| Q4 2014 | 147.0 | 114.1 |
| Q3 2014 | 148.6 | 115.2 |
| Q2 2014 | 149.7 | 116.1 |
| Q1 2014 | 151.3 | 116.8 |
| Q4 2013 | 153.2 | 117.6 |
| Q3 2013 | 154.6 | 118.2 |
| Q2 2013 | 154.0 | 117.9 |
| Q1 2013 | 152.4 | 117.6 |
| Q4 2012 | 151.5 | 116.6 |
| Q3 2012 | 148.8 | 115.9 |
| Q2 2012 | 147.9 | 114.8 |
| Q1 2012 | 147.2 | 114.5 |
| Q4 2011 | 147.4 | 114.2 |
| Q3 2011 | 147.0 | 113.7 |
| Q2 2011 | 145.1 | 112.8 |
| Q1 2011 | 142.3 | 111.4 |
| Q4 2010 | 139.2 | 110.0 |
| Q3 2010 | 135.5 | 107.2 |
| Q2 2010 | 131.7 | 103.5 |
| Q1 2010 | 125.1 | 97.7 |
| Q4 2009 | 118.4 | 93.3 |
| Q3 2009 | 110.3 | 92.8 |
| Q2 2009 | 95.3 | 94.8 |
| Q1 2009 | 100.0 | 100.0 |
| Q4 2008 | 116.4 | 109.3 |
| Q3 2008 | 123.9 | 115.5 |
| Q2 2008 | 126.9 | 116.5 |
| Q1 2008 | 126.7 | 113.6 |
| Q4 2007 | 122.1 | 107.2 |
| Q3 2007 | 114.4 | 100.4 |
| Q2 2007 | 105.6 | 90.1 |
| Q1 2007 | 97.6 | 81.6 |
| Q4 2006 | 93.1 | 75.9 |
| Q3 2006 | 89.6 | 72.1 |
| Q2 2006 | 87.3 | 68.7 |
| Q1 2006 | 85.8 | 67.2 |
| Q4 2005 | 84.5 | 66.5 |
| Q3 2005 | 83.3 | 66.1 |
| Q2 2005 | 82.3 | 65.6 |
| Q1 2005 | 81.9 | 65.2 |
| Q4 2004 | 81.3 | 64.6 |
| Q3 2004 | 80.7 | 64.2 |
| Q2 2004 | 80.4 | 64.0 |
| Q1 2004 | 80.3 | 64.0 |
Source: URA. Data to Q2 2026.
Households matter more than headcount
Demand comes from households, not people. SingStat’s household survey data shows resident households rising from 1,024,500 in 2005 to 1,487,100 in 2025, up 45%. The resident population grew only 21% over the same period. The reason is smaller households: the average fell from 3.56 to 3.06 people. (Both years are survey estimates.)
| Measure | 2005 | 2025 | Change |
|---|---|---|---|
| Resident households | 1,024,500 | 1,487,100 | +45% |
| Average household size | 3.56 | 3.06 | smaller |
| Resident population | - | - | +21% |
Source: SingStat household survey data (data.gov.sg) (2025).
So demand for homes can grow even when population growth is slow. More on this in how population growth affects property prices.
Sales volume is not physical demand
Headlines about units sold measure transaction demand. URA’s Q3 2026 flash release said volume fell about 30% on the quarter (4,296 sales to mid-September against 6,148 in Q2), yet the index rose 1.4%. Fewer people bought, but sellers did not have to cut prices. Rents and vacancy explain that better than sales counts do.
Sales (Q3 count is to mid-September, so incomplete)
Source: URA, Q3 2026 flash release (Q3 2026 flash).
Where things stand, and Propwise’s view
As at 2 October 2026, vacancy is mid-range and rents are flat to slightly up. URA expects about 60,600 private homes, including ECs, to complete over the next few years (42,472 with planning approval and 18,153 unsold units still waiting for it), with about 25,900 due by the end of 2028 (see the outlook for the detail). That is roughly 10,000 a year, about half the 2014–16 pace. It is a rough comparison: the pipeline includes ECs and ignores demolitions, and the stock series does not.
- Non-landed (condos and apartments)
- Landed
Latest: Non-landed 51,677 (Q2 2026); Landed 1,109 (Q2 2026). 10-year average 51,281 (Q3 2016 to Q2 2026).
This is a wider count than URA's headline figure of homes with planning approval (42,472 at Q2 2026, which includes ECs): it also counts projects with provisional permission and sites that are only planned.
Table view
| Period | Non-landed (condos and apartments) | Landed |
|---|---|---|
| Q2 2026 | 51,677 | 1,109 |
| Q1 2026 | 48,111 | 1,332 |
| Q4 2025 | 47,358 | 1,322 |
| Q3 2025 | 46,787 | 1,336 |
| Q2 2025 | 48,474 | 1,316 |
| Q1 2025 | 44,134 | 1,335 |
| Q4 2024 | 45,934 | 1,337 |
| Q3 2024 | 44,997 | 1,368 |
| Q2 2024 | 49,598 | 1,370 |
| Q1 2024 | 46,335 | 1,369 |
| Q4 2023 | 47,191 | 1,370 |
| Q3 2023 | 46,146 | 980 |
| Q2 2023 | 53,472 | 823 |
| Q1 2023 | 51,703 | 887 |
| Q4 2022 | 53,846 | 946 |
| Q3 2022 | 54,171 | 934 |
| Q2 2022 | 53,879 | 962 |
| Q1 2022 | 52,802 | 970 |
| Q4 2021 | 52,602 | 953 |
| Q3 2021 | 51,176 | 925 |
| Q2 2021 | 51,386 | 1,004 |
| Q1 2021 | 49,910 | 996 |
| Q4 2020 | 51,449 | 954 |
| Q3 2020 | 51,514 | 940 |
| Q2 2020 | 52,116 | 939 |
| Q1 2020 | 51,222 | 863 |
| Q4 2019 | 52,514 | 899 |
| Q3 2019 | 53,757 | 788 |
| Q2 2019 | 54,737 | 864 |
| Q1 2019 | 56,130 | 998 |
| Q4 2018 | 56,602 | 1,000 |
| Q3 2018 | 57,156 | 1,034 |
| Q2 2018 | 54,402 | 921 |
| Q1 2018 | 50,907 | 1,180 |
| Q4 2017 | 49,618 | 1,234 |
| Q3 2017 | 41,858 | 1,196 |
| Q2 2017 | 43,465 | 1,199 |
| Q1 2017 | 43,457 | 1,255 |
| Q4 2016 | 47,016 | 1,352 |
| Q3 2016 | 47,702 | 1,383 |
| Q2 2016 | 50,339 | 1,507 |
| Q1 2016 | 56,015 | 1,582 |
| Q4 2015 | 57,867 | 2,292 |
| Q3 2015 | 61,715 | 2,462 |
| Q2 2015 | 64,437 | 2,774 |
| Q1 2015 | 69,520 | 2,823 |
| Q4 2014 | 72,279 | 2,909 |
| Q3 2014 | 76,383 | 2,981 |
| Q2 2014 | 80,476 | 3,157 |
| Q1 2014 | 83,044 | 3,355 |
| Q4 2013 | 86,541 | 3,477 |
| Q3 2013 | 86,981 | 3,744 |
| Q2 2013 | 90,948 | 3,825 |
| Q1 2013 | 91,408 | 3,804 |
| Q4 2012 | 92,370 | 3,860 |
| Q3 2012 | 88,084 | 3,785 |
| Q2 2012 | 89,087 | 3,784 |
| Q1 2012 | 85,954 | 3,885 |
| Q4 2011 | 85,724 | 3,807 |
| Q3 2011 | 82,460 | 3,872 |
| Q2 2011 | 83,241 | 4,001 |
| Q1 2011 | 76,128 | 4,044 |
| Q4 2010 | 75,514 | 3,963 |
| Q3 2010 | 69,054 | 3,933 |
| Q2 2010 | 68,544 | 3,914 |
| Q1 2010 | 63,729 | 3,942 |
| Q4 2009 | 62,240 | 4,186 |
| Q3 2009 | 57,880 | 4,209 |
| Q2 2009 | 58,189 | 4,423 |
| Q1 2009 | 59,880 | 4,614 |
| Q4 2008 | 61,357 | 4,872 |
| Q3 2008 | 62,481 | 4,982 |
| Q2 2008 | 66,516 | 5,127 |
| Q1 2008 | 68,960 | 5,248 |
| Q4 2007 | 69,066 | 5,056 |
| Q3 2007 | 65,868 | 4,853 |
| Q2 2007 | 61,159 | 4,453 |
| Q1 2007 | 53,556 | 4,352 |
| Q4 2006 | 49,053 | 4,452 |
| Q3 2006 | 49,402 | 4,357 |
| Q2 2006 | 47,753 | 4,498 |
| Q1 2006 | 44,665 | 4,397 |
| Q4 2005 | 43,448 | 4,458 |
| Q3 2005 | 42,121 | 4,737 |
| Q2 2005 | 41,227 | 4,684 |
| Q1 2005 | 42,349 | 4,350 |
Source: URA. Data to Q2 2026.
Propwise’s view: the coming supply wave is lighter than in 2014–16, so supply alone does not point to a slump. The unknown is demand, and the population can swing by hundreds of thousands in a year. We would turn more cautious if vacancy stayed above 8% for two quarters while rents fell, and more positive if vacancy fell below 5.5% while rents rose. Those thresholds are our judgement from the table, not official signals. The risk to this view is a global downturn: the 2008 fall came with tight supply. See why unemployment is the real killer and how land supply is managed.
What to do with this
- Check the same three numbers each quarter, when URA publishes its statistics.
- Compare your own segment with the island-wide figures. URA’s free property market information service lists transactions and rental contracts for the last 60 months.
- Do not treat any one number as a signal. This is a way to ask better questions.
Bottom line
Prices follow rents, rents follow vacancy, and vacancy follows completions against household growth. In 2007 and 2015 the three numbers pointed the same way. In 2023 they did not, because the population moved so fast. Track all three, and remember that the supply side is easier to see than the demand side.
2 reader comments
sing
hey propwise,
what about overall increase in money supply? http://processdriventrading.files.wordpress.com/2010/12/moneysupply-and-realestate.gif
Mr. Propwise
Hi sing,
The way I look at it, money supply is an important factor affecting demand.