Where Are Singapore Property Prices Heading in Q4 2026 and 2027?
Where Singapore property heads into 2027: private prices at a record, HDB resale dipping, record land supply, SORA near 1.2%, and the risks to watch.

Singapore’s private home prices are still rising, but slowly, while HDB resale prices have now slipped for three quarters in a row. With mortgage packages at about 1.5–2.2%, the biggest land-sales programme in years and a US rate hike in September, Propwise expects a flat-to-modestly-higher private market in 2027 and a broadly flat HDB resale market: neither a boom nor a crash.
At a glance
- Private prices rose 1.4% in Q3 2026 (flash estimate) and about 3.4% over the past year. The URA index is at a record high, but sales volumes are down about 20% on 2025.
- HDB resale prices fell 0.2% in Q3 2026, the third straight quarterly dip. They are about 0.6% below the Q3 2025 peak.
- Supply is the swing factor: 9,320 private units on the 2026 Government Land Sales (GLS) Confirmed List, about 60,600 private units (including ECs) expected to complete in the coming years, 42,472 of them with planning approval, and about 19,600 BTO flats this year.
- Rates are low but the warning light is on: 3-month compounded SORA is about 1.24%, but banks raised home-loan packages after the US Federal Reserve’s September 2026 hike (floating about 1.5–1.8%, fixed about 2.0–2.2%), and Singapore inflation is rising.
- Propwise’s view for 2027: private prices +1% to +4%, HDB resale −2% to +1%. The main risks are a rate shock, a global downturn and a supply overhang.
Where the market stands in October 2026
| Indicator | Latest | Change | Trend |
|---|---|---|---|
| URA private price index1Q2009 = 100 | 219.4 (Q2 2026) | +1.4% q/q in the Q3 2026 flash estimate; +2.9% y/y to Q2 2026 | Q3 2020 – Q2 2026 |
| Landed homes | 258.4 (Q2 2026) | +2.8% q/q in the Q3 2026 flash estimate | Q3 2020 – Q2 2026 |
| Non-landed: CCR / RCR / OCRTrend line: all non-landed homes | 161.5 / 226.2 / 271.1 | -0.1% / +0.2% / +2.2% q/q in the Q3 2026 flash estimate | Q3 2020 – Q2 2026 |
| New private home sales in the monthFrom developers, excluding ECs. Launch months swing a lot | 296 (Sep 2026) | +16.1% y/y | Oct 2023 – Sep 2026 |
| Private resales in the monthCaveats, excluding ECs | 1,112 (Sep 2026) | -17.0% y/y | Oct 2023 – Sep 2026 |
| HDB resale price index1Q2009 = 100 | 202.4 (Q3 2026 flash estimate) | -0.2% q/q; -0.6% y/y | Q4 2020 – Q3 2026 |
| HDB resale transactions in the month | 2,246 (Sep 2026) | +3.3% y/y | Oct 2023 – Sep 2026 |
| HDB resales at S$1 million or more in the month | 208 (Sep 2026) | +20.9% y/y | Oct 2023 – Sep 2026 |
| Private home vacancy rate | 6.4% (Q2 2026) | +0.2 pp on the quarter before | Q3 2020 – Q2 2026 |
| 3-month compounded SORA | 1.24% (14 Oct 2026) | +0.04 pp since 14 Sep 2026 | Oct 2024 – Oct 2026 |
| Bank home-loan packagesLate Sep to early Oct 2026 | Floating about 1.5–1.8%, fixed about 2.0–2.2% | Up after the 16 Sep US rate hike |
Source: URA, HDB, HDB resale transactions, MAS (SORA), The Business Times, 2 Oct 2026 (loan packages), CNA, 18 Sep 2026 (loan packages). Index levels and changes are from the official series; sales counts and HDB medians are Propwise calculations from URA and HDB transaction data. Provisional (flash) figures are labelled as such. Each trend line shows the period written under it, scaled to its own range; the dot is the latest value.
- Core Central Region
- Rest of Central Region
- Outside Central Region
- Policy measures (select one for details)
Latest: CCR 161.5 (Q2 2026); RCR 226.2 (Q2 2026); OCR 271.1 (Q2 2026).
Table view
| Period | Core Central Region | Rest of Central Region | Outside Central Region |
|---|---|---|---|
| Q2 2026 | 161.5 | 226.2 | 271.1 |
| Q1 2026 | 158.6 | 228.9 | 271.4 |
| Q4 2025 | 157.7 | 227.1 | 265.6 |
| Q3 2025 | 163.4 | 225.5 | 263.0 |
| Q2 2025 | 160.7 | 224.8 | 260.9 |
| Q1 2025 | 156.0 | 227.3 | 258.1 |
| Q4 2024 | 154.8 | 223.5 | 257.3 |
| Q3 2024 | 150.9 | 217.0 | 249.1 |
| Q2 2024 | 152.6 | 215.3 | 249.1 |
| Q1 2024 | 153.1 | 211.9 | 248.6 |
| Q4 2023 | 148.1 | 211.3 | 248.1 |
| Q3 2023 | 142.5 | 213.0 | 237.4 |
| Q2 2023 | 146.5 | 208.6 | 225.0 |
| Q1 2023 | 146.6 | 213.9 | 222.3 |
| Q4 2022 | 145.4 | 204.9 | 218.2 |
| Q3 2022 | 144.4 | 198.7 | 224.0 |
| Q2 2022 | 141.2 | 193.3 | 208.4 |
| Q1 2022 | 138.6 | 181.7 | 204.1 |
| Q4 2021 | 138.7 | 186.7 | 199.7 |
| Q3 2021 | 135.1 | 175.0 | 188.9 |
| Q2 2021 | 135.8 | 170.6 | 189.1 |
| Q1 2021 | 134.3 | 170.4 | 185.6 |
| Q4 2020 | 133.6 | 160.6 | 183.6 |
| Q3 2020 | 129.5 | 153.8 | 180.4 |
| Q2 2020 | 134.6 | 150.0 | 177.4 |
| Q1 2020 | 131.1 | 152.6 | 177.2 |
| Q4 2019 | 134.1 | 153.4 | 177.9 |
| Q3 2019 | 138.0 | 155.4 | 173.1 |
| Q2 2019 | 135.3 | 153.4 | 171.7 |
| Q1 2019 | 132.3 | 148.2 | 171.0 |
| Q4 2018 | 136.4 | 149.2 | 170.7 |
| Q3 2018 | 137.8 | 146.6 | 169.5 |
| Q2 2018 | 136.0 | 148.5 | 169.7 |
| Q1 2018 | 134.8 | 140.6 | 164.8 |
| Q4 2017 | 127.8 | 138.9 | 156.1 |
| Q3 2017 | 126.0 | 138.3 | 154.9 |
| Q2 2017 | 125.9 | 137.6 | 153.7 |
| Q1 2017 | 126.5 | 136.8 | 154.2 |
| Q4 2016 | 127.0 | 136.4 | 154.0 |
| Q3 2016 | 126.9 | 139.2 | 154.9 |
| Q2 2016 | 129.4 | 140.6 | 156.5 |
| Q1 2016 | 129.0 | 140.3 | 157.3 |
| Q4 2015 | 128.6 | 140.3 | 159.4 |
| Q3 2015 | 129.0 | 140.9 | 159.4 |
| Q2 2015 | 130.6 | 143.2 | 162.0 |
| Q1 2015 | 131.4 | 144.1 | 163.8 |
| Q4 2014 | 131.9 | 146.6 | 165.6 |
| Q3 2014 | 133.1 | 148.6 | 167.0 |
| Q2 2014 | 134.2 | 149.2 | 167.6 |
| Q1 2014 | 136.2 | 149.7 | 169.1 |
| Q4 2013 | 137.6 | 154.8 | 169.3 |
| Q3 2013 | 140.5 | 154.2 | 170.9 |
| Q2 2013 | 140.9 | 155.6 | 167.3 |
| Q1 2013 | 141.2 | 155.3 | 161.1 |
| Q4 2012 | 140.3 | 155.0 | 158.9 |
| Q3 2012 | 139.4 | 153.6 | 153.2 |
| Q2 2012 | 139.2 | 152.3 | 151.6 |
| Q1 2012 | 138.4 | 151.7 | 150.9 |
| Q4 2011 | 139.2 | 152.5 | 149.2 |
| Q3 2011 | 138.5 | 152.4 | 148.4 |
| Q2 2011 | 137.5 | 150.6 | 145.3 |
| Q1 2011 | 135.3 | 148.9 | 142.8 |
| Q4 2010 | 133.9 | 145.9 | 138.6 |
| Q3 2010 | 131.0 | 143.3 | 135.8 |
| Q2 2010 | 128.9 | 140.0 | 132.9 |
| Q1 2010 | 122.4 | 133.8 | 125.7 |
| Q4 2009 | 117.2 | 124.1 | 120.5 |
| Q3 2009 | 109.2 | 113.3 | 113.4 |
| Q2 2009 | 94.8 | 95.6 | 97.7 |
| Q1 2009 | 100.0 | 100.0 | 100.0 |
| Q4 2008 | 119.4 | 120.4 | 107.9 |
| Q3 2008 | 127.6 | 128.3 | 114.6 |
| Q2 2008 | 131.2 | 131.5 | 116.3 |
| Q1 2008 | 131.3 | 130.6 | 115.2 |
| Q4 2007 | 126.5 | 126.4 | 111.0 |
| Q3 2007 | 117.7 | 117.4 | 103.7 |
| Q2 2007 | 108.6 | 108.7 | 96.1 |
| Q1 2007 | 100.7 | 100.6 | 89.7 |
| Q4 2006 | 95.4 | 96.9 | 87.9 |
| Q3 2006 | 90.9 | 94.8 | 86.5 |
| Q2 2006 | 86.3 | 94.4 | 85.8 |
| Q1 2006 | 82.5 | 94.4 | 84.5 |
| Q4 2005 | 81.5 | 94.1 | 84.3 |
| Q3 2005 | 79.7 | 94.1 | 83.6 |
| Q2 2005 | 77.9 | 94.1 | 83.6 |
| Q1 2005 | 77.6 | 93.7 | 83.6 |
| Q4 2004 | 76.9 | 92.9 | 83.4 |
| Q3 2004 | 76.4 | 92.2 | 83.0 |
| Q2 2004 | 76.1 | 91.6 | 82.7 |
| Q1 2004 | 76.0 | 91.5 | 83.0 |
Policy measures marked on this chart (22)
- 2025-07-03 Seller's Stamp Duty holding period back to four years, rates raised by 4 pp
- 2024-08-19 HDB loan LTV cut to 75% and Enhanced CPF Housing Grant raised
- 2023-04-26 ABSD rates raised, April 2023
- 2023-02-14 CPF Housing Grant raised for first-time resale buyers, Budget 2023
- 2023-02-14 Buyer's Stamp Duty raised for higher-value properties, Budget 2023
- 2022-09-29 Property measures, September 2022: higher TDSR and MSR rate floor, HDB loan LTV 80%, 15-month wait-out
- 2021-12-15 Property cooling measures, December 2021: higher ABSD, TDSR 55%, HDB loan LTV 85%
- 2018-07-05 Property cooling measures, July 2018: higher ABSD and lower LTV limits
- 2018-02-19 Budget 2018: Proximity Housing Grant enhanced
- 2018-02-19 Budget 2018: top BSD rate raised to 4% above S$1m
- 2017-03-10 SSD holding period cut to 3 years; TDSR relaxed for equity withdrawal
- 2013-08-27 HDB loan and resale measures, August 2013
- 2013-06-28 MAS introduces the Total Debt Servicing Ratio (TDSR) framework
- 2013-01-11 Property cooling measures, January 2013
- 2012-10-05 Maximum loan tenure of 35 years and tighter LTV limits, October 2012
- 2011-12-07 Additional Buyer's Stamp Duty introduced, December 2011
- 2011-01-13 Property cooling measures, January 2011
- 2010-08-30 HDB measures after National Day Rally 2010: DBSS income ceiling, 5-year MOP for non-subsidised flats
- 2010-08-30 Property cooling measures, August 2010
- 2010-02-19 Seller's Stamp Duty introduced and LTV limit cut to 80%, February 2010
- 2009-09-14 Interest-only loans and Interest Absorption Scheme disallowed, September 2009
- 2005-07-19 Property policy review, July 2005: LTV limit raised to 90%, CPF housing rules eased, foreign ownership rules eased
Two things stand out. First, the private market is grinding, not surging. Every quarterly change since the start of 2025 has been between +0.5% and +1.4%, and URA says prices rose an average of 0.9% a quarter in the first three quarters of both 2025 and 2026. Second, prices and volumes are pulling apart: prices hit new highs while fewer homes change hands. That usually means sellers are holding firm and buyers are choosier, not that demand is booming. The flash estimate uses partial-quarter data; URA publishes full Q3 figures on 23 October 2026.
What changed in 2026: the policy scorecard
The Government made targeted changes for first-timers, HDB buyers, ECs and old estates, and left the investor-facing measures alone.
| Date | Change | Who it affects |
|---|---|---|
| 8 May 2026 | EC scheme tightened for new sites: 10-year MOP, open to foreigners only after year 15, no Deferred Payment Scheme, 90% first-timer quota | Future EC buyers |
| 28 Jul 2026 | 15-month wait-out removed for private owners buying a non-subsidised resale flat without an HDB loan (they must sell the private home within 6 months) | Downgraders, retirees |
| 28 Jul 2026 | Longer ABSD remission timelines for developers of large en bloc sites (6 to 7 years) | Developers, en bloc owners |
| 24 Aug 2026 | HDB income ceiling raised from S$14,000 to S$16,000 for families (S$8,000 for singles); new-EC ceiling S$18,000 | BTO and EC applicants |
| 4 Aug and 8 Sep 2026 | En bloc bill: consent threshold to fall to 70% for developments aged 40–59 years and 65% for 60 years and older; passed by Parliament on 8 Sep but not yet in force; start date not yet announced | Owners of older condos |
What did not change: ABSD (20% for a citizen’s second home, 60% for foreigners, unchanged since April 2023), the 55% TDSR and 4% stress-test rate, the 4-year Seller’s Stamp Duty for homes bought from July 2025, and the 75% HDB loan limit. Readers coming from our 2021 outlook should note that almost every number in it has since changed: TDSR was 60%, ABSD for a second home was 12%, and home loans were priced off SIBOR, which no longer exists.
- Citizen, second home
- 20%
- Foreigner
- 60%
- Share of gross income
- 55%
- Stress-test rate
- 4%
- Holding period
- 4 years
- Share of price
- 75%
Source: IRAS, ABSD (October 2026); MAS, MSR and TDSR rules; MAS, SSD holding period; HDB loan guide.
So far the wait-out removal has not moved prices: HDB said in its 30 September release that it had not seen a significant increase in resale prices or volumes.
Supply: the factor that caps prices
The Government has deliberately front-loaded land supply. The 2026 GLS Confirmed List totals 9,320 private units (including ECs), more than 50% above the 10-year average, and the second-half Reserve List can release about 4,455 more if developers ask.
URA counts 42,472 units (including ECs) in the pipeline with planning approval. Adding 18,153 unsold units that have no planning approval yet gives about 60,600 units expected to complete in the coming years. Only 2,483 units (including 872 EC units) were completed in the first half of 2026, but about 25,900 are due by the end of 2028 and about 34,700 after that. URA counts about 15,810 unsold units with planning approval, and estimates around 32,000 unsold units could be put on sale within two years.
- Non-landed (condos and apartments)
- Landed
Latest: Non-landed 51,677 (Q2 2026); Landed 1,109 (Q2 2026).
This is a wider count than URA's headline figure of homes with planning approval (42,472 at Q2 2026, which includes ECs): it also counts projects with provisional permission and sites that are only planned.
Table view
| Period | Non-landed (condos and apartments) | Landed |
|---|---|---|
| Q2 2026 | 51,677 | 1,109 |
| Q1 2026 | 48,111 | 1,332 |
| Q4 2025 | 47,358 | 1,322 |
| Q3 2025 | 46,787 | 1,336 |
| Q2 2025 | 48,474 | 1,316 |
| Q1 2025 | 44,134 | 1,335 |
| Q4 2024 | 45,934 | 1,337 |
| Q3 2024 | 44,997 | 1,368 |
| Q2 2024 | 49,598 | 1,370 |
| Q1 2024 | 46,335 | 1,369 |
| Q4 2023 | 47,191 | 1,370 |
| Q3 2023 | 46,146 | 980 |
| Q2 2023 | 53,472 | 823 |
| Q1 2023 | 51,703 | 887 |
| Q4 2022 | 53,846 | 946 |
| Q3 2022 | 54,171 | 934 |
| Q2 2022 | 53,879 | 962 |
| Q1 2022 | 52,802 | 970 |
| Q4 2021 | 52,602 | 953 |
| Q3 2021 | 51,176 | 925 |
| Q2 2021 | 51,386 | 1,004 |
| Q1 2021 | 49,910 | 996 |
| Q4 2020 | 51,449 | 954 |
| Q3 2020 | 51,514 | 940 |
| Q2 2020 | 52,116 | 939 |
| Q1 2020 | 51,222 | 863 |
| Q4 2019 | 52,514 | 899 |
| Q3 2019 | 53,757 | 788 |
| Q2 2019 | 54,737 | 864 |
| Q1 2019 | 56,130 | 998 |
| Q4 2018 | 56,602 | 1,000 |
| Q3 2018 | 57,156 | 1,034 |
| Q2 2018 | 54,402 | 921 |
| Q1 2018 | 50,907 | 1,180 |
| Q4 2017 | 49,618 | 1,234 |
| Q3 2017 | 41,858 | 1,196 |
| Q2 2017 | 43,465 | 1,199 |
| Q1 2017 | 43,457 | 1,255 |
| Q4 2016 | 47,016 | 1,352 |
| Q3 2016 | 47,702 | 1,383 |
| Q2 2016 | 50,339 | 1,507 |
| Q1 2016 | 56,015 | 1,582 |
| Q4 2015 | 57,867 | 2,292 |
| Q3 2015 | 61,715 | 2,462 |
| Q2 2015 | 64,437 | 2,774 |
| Q1 2015 | 69,520 | 2,823 |
| Q4 2014 | 72,279 | 2,909 |
| Q3 2014 | 76,383 | 2,981 |
| Q2 2014 | 80,476 | 3,157 |
| Q1 2014 | 83,044 | 3,355 |
| Q4 2013 | 86,541 | 3,477 |
| Q3 2013 | 86,981 | 3,744 |
| Q2 2013 | 90,948 | 3,825 |
| Q1 2013 | 91,408 | 3,804 |
| Q4 2012 | 92,370 | 3,860 |
| Q3 2012 | 88,084 | 3,785 |
| Q2 2012 | 89,087 | 3,784 |
| Q1 2012 | 85,954 | 3,885 |
| Q4 2011 | 85,724 | 3,807 |
| Q3 2011 | 82,460 | 3,872 |
| Q2 2011 | 83,241 | 4,001 |
| Q1 2011 | 76,128 | 4,044 |
| Q4 2010 | 75,514 | 3,963 |
| Q3 2010 | 69,054 | 3,933 |
| Q2 2010 | 68,544 | 3,914 |
| Q1 2010 | 63,729 | 3,942 |
| Q4 2009 | 62,240 | 4,186 |
| Q3 2009 | 57,880 | 4,209 |
| Q2 2009 | 58,189 | 4,423 |
| Q1 2009 | 59,880 | 4,614 |
| Q4 2008 | 61,357 | 4,872 |
| Q3 2008 | 62,481 | 4,982 |
| Q2 2008 | 66,516 | 5,127 |
| Q1 2008 | 68,960 | 5,248 |
| Q4 2007 | 69,066 | 5,056 |
| Q3 2007 | 65,868 | 4,853 |
| Q2 2007 | 61,159 | 4,453 |
| Q1 2007 | 53,556 | 4,352 |
| Q4 2006 | 49,053 | 4,452 |
| Q3 2006 | 49,402 | 4,357 |
| Q2 2006 | 47,753 | 4,498 |
| Q1 2006 | 44,665 | 4,397 |
| Q4 2005 | 43,448 | 4,458 |
| Q3 2005 | 42,121 | 4,737 |
| Q2 2005 | 41,227 | 4,684 |
| Q1 2005 | 42,349 | 4,350 |
What this means: completions are light now, which has kept the vacancy rate in the 6% range and rents edging up (+0.7% in Q2 2026). From 2027 the completion wave arrives. More finished units compete for tenants and for resale buyers, and that is the main reason we do not expect a sharp rise in prices.
Latest: Vacancy 6.4% (Q2 2026).
Vacancy is calculated as vacant units divided by units available, using URA counts of completed private homes (landed and non-landed).
Table view
| Period | Private homes vacant (%) |
|---|---|
| Q2 2026 | 6.4% |
| Q1 2026 | 6.2% |
| Q4 2025 | 6.0% |
| Q3 2025 | 6.9% |
| Q2 2025 | 7.1% |
| Q1 2025 | 6.5% |
| Q4 2024 | 6.6% |
| Q3 2024 | 7.2% |
| Q2 2024 | 6.1% |
| Q1 2024 | 6.8% |
| Q4 2023 | 8.1% |
| Q3 2023 | 8.4% |
| Q2 2023 | 6.3% |
| Q1 2023 | 6.0% |
| Q4 2022 | 5.5% |
| Q3 2022 | 5.7% |
| Q2 2022 | 5.4% |
| Q1 2022 | 5.3% |
| Q4 2021 | 6.0% |
| Q3 2021 | 6.4% |
| Q2 2021 | 6.3% |
| Q1 2021 | 6.4% |
| Q4 2020 | 7.0% |
| Q3 2020 | 6.2% |
| Q2 2020 | 5.4% |
| Q1 2020 | 5.4% |
| Q4 2019 | 5.5% |
| Q3 2019 | 6.1% |
| Q2 2019 | 6.4% |
| Q1 2019 | 6.3% |
| Q4 2018 | 6.4% |
| Q3 2018 | 6.8% |
| Q2 2018 | 7.1% |
| Q1 2018 | 7.4% |
| Q4 2017 | 7.8% |
| Q3 2017 | 8.4% |
| Q2 2017 | 8.1% |
| Q1 2017 | 8.1% |
| Q4 2016 | 8.4% |
| Q3 2016 | 8.7% |
| Q2 2016 | 8.9% |
| Q1 2016 | 7.5% |
| Q4 2015 | 8.1% |
| Q3 2015 | 7.8% |
| Q2 2015 | 7.9% |
| Q1 2015 | 7.2% |
| Q4 2014 | 7.8% |
| Q3 2014 | 7.1% |
| Q2 2014 | 7.1% |
| Q1 2014 | 6.6% |
| Q4 2013 | 6.2% |
| Q3 2013 | 6.1% |
| Q2 2013 | 5.6% |
| Q1 2013 | 5.2% |
| Q4 2012 | 5.4% |
| Q3 2012 | 6.1% |
| Q2 2012 | 5.9% |
| Q1 2012 | 6.0% |
| Q4 2011 | 5.9% |
| Q3 2011 | 5.8% |
| Q2 2011 | 5.1% |
| Q1 2011 | 4.9% |
| Q4 2010 | 5.0% |
| Q3 2010 | 5.2% |
| Q2 2010 | 5.4% |
| Q1 2010 | 4.6% |
| Q4 2009 | 5.0% |
| Q3 2009 | 6.2% |
| Q2 2009 | 5.9% |
| Q1 2009 | 5.9% |
| Q4 2008 | 6.1% |
| Q3 2008 | 5.8% |
| Q2 2008 | 6.1% |
| Q1 2008 | 6.3% |
| Q4 2007 | 5.6% |
| Q3 2007 | 5.4% |
| Q2 2007 | 4.9% |
| Q1 2007 | 5.1% |
| Q4 2006 | 6.1% |
| Q3 2006 | 6.6% |
| Q2 2006 | 6.5% |
| Q1 2006 | 7.4% |
| Q4 2005 | 8.4% |
| Q3 2005 | 8.5% |
| Q2 2005 | 8.7% |
| Q1 2005 | 8.8% |
| Q4 2004 | 8.1% |
| Q3 2004 | 8.5% |
| Q2 2004 | 8.3% |
| Q1 2004 | 8.4% |
| Q4 2003 | 7.7% |
| Q3 2003 | 8.1% |
| Q2 2003 | 7.6% |
| Q1 2003 | 7.6% |
| Q4 2002 | 8.5% |
| Q3 2002 | 8.1% |
| Q2 2002 | 8.3% |
| Q1 2002 | 7.6% |
| Q4 2001 | 8.2% |
| Q3 2001 | 7.6% |
| Q2 2001 | 7.1% |
| Q1 2001 | 6.5% |
| Q4 2000 | 6.9% |
| Q3 2000 | 7.9% |
| Q2 2000 | 9.1% |
| Q1 2000 | 8.5% |
On the HDB side, HDB plans about 19,600 BTO flats in 2026, including about 7,960 in the November exercise. The number of flats reaching their minimum occupation period (MOP) is also rising each year through 2028 (AsiaOne). More flats eligible for resale, plus a higher BTO income ceiling that keeps more families in the BTO queue, is why HDB resale prices have stalled after a 9.7% rise in 2024.
Interest rates: cheap money, with a warning light
The 3-month compounded SORA, the benchmark for most floating home loans, was about 1.24% on 14 Oct 2026. Packages are priced at SORA plus a spread, or fixed for two to three years, and banks raised them after the US rate hike on 16 September: floating loans now cost about 1.5–1.8% and fixed loans about 2.0–2.2%, as reported by The Business Times (2 October 2026) and CNA (18 September 2026). That is still far below 2023, when SORA itself peaked at about 3.7–3.8%.
- 3-month compounded SORA (Singapore)
- US federal funds rate (effective)
Latest: SORA 1.24% (14 Oct 2026); Fed 3.88% (13 Oct 2026).
SORA is the benchmark for floating-rate home loans in Singapore. The US rate is shown for context: it moves SORA only indirectly, through the Singapore dollar and bank funding costs.
Table view
| Period | 3-month compounded SORA (Singapore) | US federal funds rate (effective) |
|---|---|---|
| Oct 2026 | 1.24% | 3.88% |
| Sep 2026 | 1.23% | 3.88% |
| Aug 2026 | 1.18% | 3.63% |
| Jul 2026 | 1.14% | 3.63% |
| Jun 2026 | 1.08% | 3.63% |
| May 2026 | 1.06% | 3.62% |
| Apr 2026 | 1.03% | 3.64% |
| Mar 2026 | 1.07% | 3.64% |
| Feb 2026 | 1.12% | 3.64% |
| Jan 2026 | 1.15% | 3.64% |
| Dec 2025 | 1.19% | 3.64% |
| Nov 2025 | 1.25% | 3.89% |
| Oct 2025 | 1.32% | 4.11% |
| Sep 2025 | 1.46% | 4.09% |
| Aug 2025 | 1.56% | 4.33% |
| Jul 2025 | 1.86% | 4.33% |
| Jun 2025 | 2.06% | 4.33% |
| May 2025 | 2.27% | 4.33% |
| Apr 2025 | 2.40% | 4.33% |
| Mar 2025 | 2.55% | 4.33% |
| Feb 2025 | 2.73% | 4.33% |
| Jan 2025 | 2.90% | 4.33% |
| Dec 2024 | 3.08% | 4.33% |
| Nov 2024 | 3.21% | 4.58% |
| Oct 2024 | 3.39% | 4.83% |
| Sep 2024 | 3.49% | 4.83% |
| Aug 2024 | 3.57% | 5.33% |
| Jul 2024 | 3.64% | 5.33% |
| Jun 2024 | 3.63% | 5.33% |
| May 2024 | 3.66% | 5.33% |
| Apr 2024 | 3.65% | 5.33% |
| Mar 2024 | 3.68% | 5.33% |
| Feb 2024 | 3.64% | 5.33% |
| Jan 2024 | 3.66% | 5.33% |
| Dec 2023 | 3.70% | 5.33% |
| Nov 2023 | 3.75% | 5.33% |
| Oct 2023 | 3.75% | 5.33% |
| Sep 2023 | 3.70% | 5.33% |
| Aug 2023 | 3.70% | 5.33% |
| Jul 2023 | 3.68% | 5.33% |
| Jun 2023 | 3.65% | 5.07% |
| May 2023 | 3.61% | 5.08% |
| Apr 2023 | 3.61% | 4.83% |
| Mar 2023 | 3.58% | 4.83% |
| Feb 2023 | 3.23% | 4.58% |
| Jan 2023 | 3.12% | 4.33% |
| Dec 2022 | 3.03% | 4.33% |
| Nov 2022 | 2.87% | 3.83% |
| Oct 2022 | 2.45% | 3.08% |
| Sep 2022 | 2.07% | 3.08% |
| Aug 2022 | 1.55% | 2.33% |
| Jul 2022 | 1.27% | 2.32% |
| Jun 2022 | 0.72% | 1.58% |
| May 2022 | 0.52% | 0.83% |
| Apr 2022 | 0.32% | 0.33% |
| Mar 2022 | 0.27% | 0.33% |
| Feb 2022 | 0.25% | 0.08% |
| Jan 2022 | 0.20% | 0.08% |
| Dec 2021 | 0.19% | 0.08% |
| Nov 2021 | 0.16% | 0.08% |
| Oct 2021 | 0.16% | 0.07% |
| Sep 2021 | 0.13% | 0.08% |
| Aug 2021 | 0.13% | 0.08% |
| Jul 2021 | 0.13% | 0.10% |
| Jun 2021 | 0.14% | 0.10% |
| May 2021 | 0.17% | 0.05% |
| Apr 2021 | 0.19% | 0.07% |
| Mar 2021 | 0.23% | 0.07% |
| Feb 2021 | 0.20% | 0.07% |
| Jan 2021 | 0.17% | 0.07% |
| Dec 2020 | 0.17% | 0.09% |
| Nov 2020 | 0.12% | 0.08% |
| Oct 2020 | 0.12% | 0.09% |
| Sep 2020 | 0.10% | 0.09% |
| Aug 2020 | 0.10% | 0.09% |
| Jul 2020 | 0.08% | 0.09% |
| Jun 2020 | 0.14% | 0.08% |
| May 2020 | 0.27% | 0.05% |
| Apr 2020 | 0.53% | 0.05% |
| Mar 2020 | 0.90% | 0.10% |
| Feb 2020 | 1.14% | 1.58% |
| Jan 2020 | 1.20% | 1.55% |
| Dec 2019 | 1.27% | 1.55% |
| Nov 2019 | 1.31% | 1.55% |
| Oct 2019 | 1.46% | 1.83% |
| Sep 2019 | 1.53% | 1.83% |
| Aug 2019 | 1.59% | 2.12% |
| Jul 2019 | 1.67% | 2.40% |
| Jun 2019 | 1.72% | 2.40% |
| May 2019 | 1.68% | 2.38% |
| Apr 2019 | 1.62% | 2.44% |
| Mar 2019 | 1.54% | 2.43% |
| Feb 2019 | 1.59% | 2.40% |
| Jan 2019 | 1.52% | 2.40% |
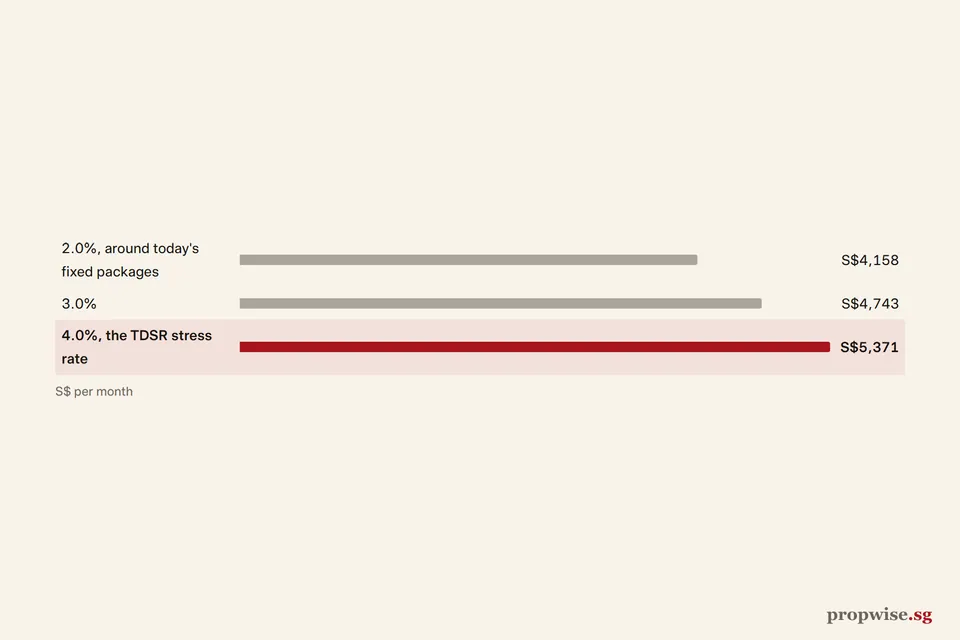
Here is what that means for a typical purchase. Say you buy a S$1.5m condo with a 75% loan of S$1.125m over 30 years:
| Mortgage rate | Monthly instalment |
|---|---|
| 1.75% (mid-range floating today) | S$4,019 |
| 2.1% (mid-range fixed today) | S$4,215 |
| 3.5% | S$5,052 |
| 4.0% (the TDSR stress-test rate) | S$5,371 |
S$ a month
Source: Propwise calculation (mortgage calculator) (October 2026). Rates are examples: about 1.5-1.8% floating and 2.0-2.2% fixed in late September 2026 (The Business Times, 2 Oct 2026).
At 4%, the bank needs your monthly debt payments to be within 55% of gross income, so with no other debts you need about S$9,765 a month to qualify. Try your own numbers in our mortgage calculator.
The warning light: on 16 September 2026 the US Federal Reserve raised its policy rate by 0.25 points to 3.75–4.00%, saying inflation “remains elevated”. In Singapore, consumer prices rose about 1.8% in the year to Q2 2026, up from about 0.6% a year earlier. MAS steers policy through the exchange rate, not interest rates, so SORA does not follow the Fed one for one. But SORA rose sharply in 2022–23 when US rates rose, and it could do so again.
One reason Singapore prices did not crack in 2022–23 is the stress test. Banks already size loans as if rates were 4%, so buyers were not stretched when rates actually rose. The same rule means today’s low rates have not raised how much people can borrow. More on this in how interest rates affect property prices.
Demand: a strong economy, but upgraders are less flush
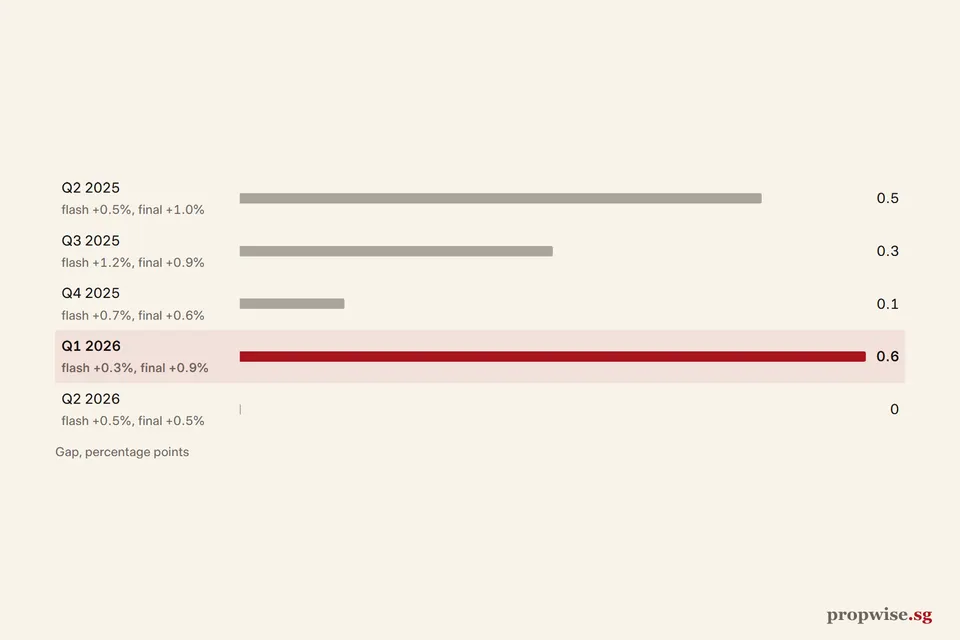
The economy is doing better than most people expected: real GDP grew 6.3% year on year in the quarter before and 5.9% in Q2 2026. Jobs and incomes, not interest rates, are what keep owners from becoming forced sellers.
Latest: GDP 5.9% (Q2 2026).
Final figures from SingStat. The advance estimate for each quarter comes about six weeks earlier and is not shown.
Table view
| Period | Real GDP growth (% y/y) |
|---|---|
| Q2 2026 | 5.9% |
| Q1 2026 | 6.3% |
| Q4 2025 | 5.7% |
| Q3 2025 | 4.5% |
| Q2 2025 | 5.4% |
| Q1 2025 | 4.5% |
| Q4 2024 | 5.3% |
| Q3 2024 | 7.0% |
| Q2 2024 | 4.8% |
| Q1 2024 | 4.3% |
| Q4 2023 | 3.1% |
| Q3 2023 | 1.6% |
| Q2 2023 | 0.6% |
| Q1 2023 | 0.5% |
| Q4 2022 | 2.4% |
| Q3 2022 | 4.4% |
| Q2 2022 | 5.0% |
| Q1 2022 | 4.4% |
| Q4 2021 | 8.0% |
| Q3 2021 | 9.7% |
| Q2 2021 | 18.9% |
| Q1 2021 | 4.9% |
| Q4 2020 | -0.1% |
| Q3 2020 | -3.9% |
| Q2 2020 | -11.7% |
| Q1 2020 | 1.4% |
| Q4 2019 | 1.6% |
| Q3 2019 | 0.6% |
| Q2 2019 | 1.1% |
| Q1 2019 | 1.3% |
| Q4 2018 | 1.1% |
| Q3 2018 | 2.8% |
| Q2 2018 | 4.5% |
| Q1 2018 | 4.4% |
| Q4 2017 | 4.2% |
| Q3 2017 | 5.0% |
| Q2 2017 | 3.5% |
| Q1 2017 | 4.6% |
| Q4 2016 | 5.2% |
| Q3 2016 | 3.5% |
| Q2 2016 | 3.4% |
| Q1 2016 | 3.5% |
| Q4 2015 | 2.2% |
| Q3 2015 | 3.7% |
| Q2 2015 | 3.1% |
| Q1 2015 | 3.0% |
| Q4 2014 | 4.5% |
| Q3 2014 | 3.7% |
| Q2 2014 | 3.3% |
| Q1 2014 | 4.3% |
| Q4 2013 | 5.1% |
| Q3 2013 | 6.1% |
| Q2 2013 | 4.6% |
| Q1 2013 | 3.4% |
| Q4 2012 | 4.7% |
| Q3 2012 | 2.0% |
| Q2 2012 | 6.2% |
| Q1 2012 | 4.8% |
| Q4 2011 | 5.3% |
| Q3 2011 | 7.8% |
| Q2 2011 | 2.9% |
| Q1 2011 | 9.2% |
| Q4 2010 | 13.3% |
| Q3 2010 | 10.3% |
| Q2 2010 | 18.6% |
| Q1 2010 | 16.3% |
| Q4 2009 | 6.8% |
| Q3 2009 | 2.8% |
| Q2 2009 | -1.2% |
| Q1 2009 | -7.7% |
| Q4 2008 | -3.4% |
| Q3 2008 | -0.1% |
| Q2 2008 | 3.3% |
| Q1 2008 | 8.2% |
| Q4 2007 | 6.6% |
| Q3 2007 | 11.0% |
| Q2 2007 | 10.0% |
| Q1 2007 | 8.6% |
| Q4 2006 | 8.5% |
| Q3 2006 | 8.6% |
| Q2 2006 | 8.8% |
| Q1 2006 | 10.2% |
| Q4 2005 | 9.2% |
| Q3 2005 | 8.5% |
| Q2 2005 | 6.2% |
| Q1 2005 | 5.4% |
Source: Department of Statistics (via SingStat). Data to Q2 2026.
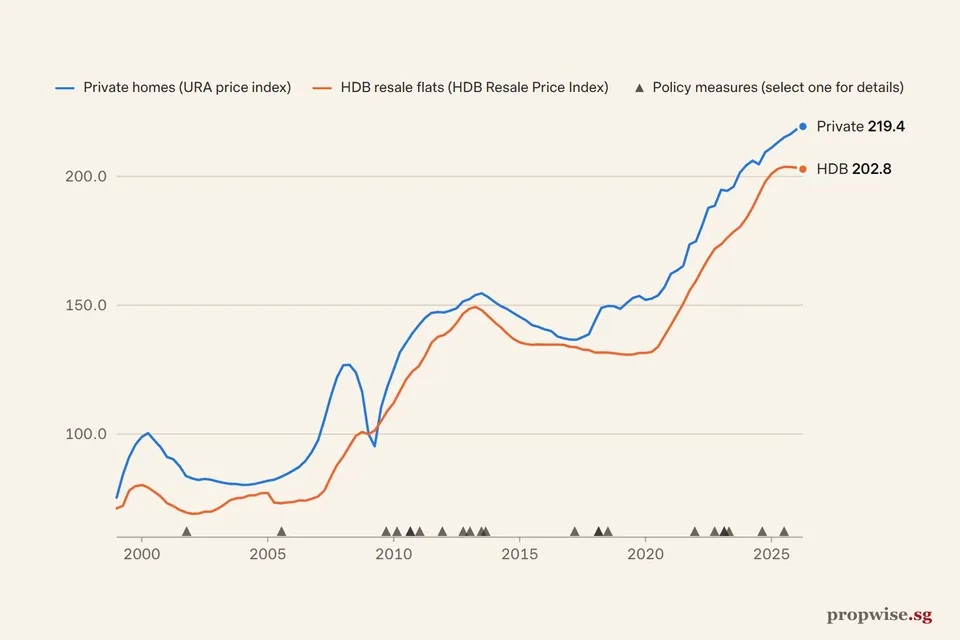
The weaker link is the HDB upgrader. HDB resale prices rose about 53% between Q2 2020 and Q3 2026, and that equity paid for many condo purchases. With resale prices now flat, upgraders cannot count on a rising sale price. Big flats still sell well (596 resales at S$1m or more in Q3 2026), but the typical upgrader is no longer getting richer each quarter. In the private market, Q3 demand favoured suburban (OCR) condos and landed homes over prime CCR units.
- Policy measures (select one for details)
Latest: HDB 202.8 (Q2 2026).
HDB adjusts for the mix of flats sold: it used stratification up to 3Q2014 and a stratified hedonic regression from 4Q2014 (HDB, data.gov.sg). Quarters appear when HDB publishes the final figure.
Table view
| Period | HDB Resale Price Index |
|---|---|
| Q2 2026 | 202.8 |
| Q1 2026 | 203.4 |
| Q4 2025 | 203.6 |
| Q3 2025 | 203.7 |
| Q2 2025 | 202.9 |
| Q1 2025 | 201.0 |
| Q4 2024 | 197.9 |
| Q3 2024 | 192.9 |
| Q2 2024 | 187.9 |
| Q1 2024 | 183.7 |
| Q4 2023 | 180.4 |
| Q3 2023 | 178.5 |
| Q2 2023 | 176.2 |
| Q1 2023 | 173.6 |
| Q4 2022 | 171.9 |
| Q3 2022 | 168.1 |
| Q2 2022 | 163.9 |
| Q1 2022 | 159.5 |
| Q4 2021 | 155.7 |
| Q3 2021 | 150.6 |
| Q2 2021 | 146.4 |
| Q1 2021 | 142.2 |
| Q4 2020 | 138.1 |
| Q3 2020 | 133.9 |
| Q2 2020 | 131.9 |
| Q1 2020 | 131.5 |
| Q4 2019 | 131.5 |
| Q3 2019 | 130.9 |
| Q2 2019 | 130.8 |
| Q1 2019 | 131.0 |
| Q4 2018 | 131.4 |
| Q3 2018 | 131.6 |
| Q2 2018 | 131.7 |
| Q1 2018 | 131.6 |
| Q4 2017 | 132.6 |
| Q3 2017 | 132.8 |
| Q2 2017 | 133.7 |
| Q1 2017 | 133.9 |
| Q4 2016 | 134.6 |
| Q3 2016 | 134.7 |
| Q2 2016 | 134.7 |
| Q1 2016 | 134.7 |
| Q4 2015 | 134.8 |
| Q3 2015 | 134.6 |
| Q2 2015 | 135.0 |
| Q1 2015 | 135.6 |
Policy measures marked on this chart (11)
- 2025-07-03 Seller's Stamp Duty holding period back to four years, rates raised by 4 pp
- 2024-08-19 HDB loan LTV cut to 75% and Enhanced CPF Housing Grant raised
- 2023-04-26 ABSD rates raised, April 2023
- 2023-02-14 CPF Housing Grant raised for first-time resale buyers, Budget 2023
- 2023-02-14 Buyer's Stamp Duty raised for higher-value properties, Budget 2023
- 2022-09-29 Property measures, September 2022: higher TDSR and MSR rate floor, HDB loan LTV 80%, 15-month wait-out
- 2021-12-15 Property cooling measures, December 2021: higher ABSD, TDSR 55%, HDB loan LTV 85%
- 2018-07-05 Property cooling measures, July 2018: higher ABSD and lower LTV limits
- 2018-02-19 Budget 2018: Proximity Housing Grant enhanced
- 2018-02-19 Budget 2018: top BSD rate raised to 4% above S$1m
- 2017-03-10 SSD holding period cut to 3 years; TDSR relaxed for equity withdrawal
Latest: S$1m+ 208 (Sep 2026).
Counts are by registration month. A month appears once it is complete.
Table view
| Period | Resales at S$1 million or more |
|---|---|
| Sep 2026 | 208 |
| Aug 2026 | 201 |
| Jul 2026 | 187 |
| Jun 2026 | 188 |
| May 2026 | 165 |
| Apr 2026 | 137 |
| Mar 2026 | 144 |
| Feb 2026 | 122 |
| Jan 2026 | 145 |
| Dec 2025 | 144 |
| Nov 2025 | 120 |
| Oct 2025 | 86 |
| Sep 2025 | 172 |
| Aug 2025 | 141 |
| Jul 2025 | 167 |
| Jun 2025 | 132 |
| May 2025 | 142 |
| Apr 2025 | 141 |
| Mar 2025 | 108 |
| Feb 2025 | 121 |
| Jan 2025 | 119 |
| Dec 2024 | 95 |
| Nov 2024 | 87 |
| Oct 2024 | 103 |
| Sep 2024 | 106 |
| Aug 2024 | 105 |
| Jul 2024 | 120 |
| Jun 2024 | 95 |
| May 2024 | 73 |
| Apr 2024 | 68 |
| Mar 2024 | 60 |
| Feb 2024 | 49 |
| Jan 2024 | 74 |
| Dec 2023 | 48 |
| Nov 2023 | 45 |
| Oct 2023 | 40 |
| Sep 2023 | 42 |
| Aug 2023 | 54 |
| Jul 2023 | 32 |
| Jun 2023 | 34 |
| May 2023 | 34 |
| Apr 2023 | 37 |
| Mar 2023 | 39 |
| Feb 2023 | 24 |
| Jan 2023 | 40 |
| Dec 2022 | 28 |
| Nov 2022 | 26 |
| Oct 2022 | 38 |
| Sep 2022 | 45 |
| Aug 2022 | 33 |
| Jul 2022 | 33 |
| Jun 2022 | 31 |
| May 2022 | 30 |
| Apr 2022 | 22 |
| Mar 2022 | 27 |
| Feb 2022 | 29 |
| Jan 2022 | 27 |
| Dec 2021 | 36 |
| Nov 2021 | 29 |
| Oct 2021 | 20 |
| Sep 2021 | 23 |
| Aug 2021 | 26 |
| Jul 2021 | 19 |
| Jun 2021 | 19 |
| May 2021 | 13 |
| Apr 2021 | 21 |
| Mar 2021 | 17 |
| Feb 2021 | 23 |
| Jan 2021 | 13 |
| Dec 2020 | 10 |
| Nov 2020 | 13 |
| Oct 2020 | 13 |
| Sep 2020 | 8 |
| Aug 2020 | 5 |
| Jul 2020 | 9 |
| Jun 2020 | 8 |
| May 2020 | 2 |
| Apr 2020 | 1 |
| Mar 2020 | 5 |
| Feb 2020 | 4 |
| Jan 2020 | 4 |
| Dec 2019 | 2 |
| Nov 2019 | 4 |
| Oct 2019 | 1 |
| Sep 2019 | 4 |
| Aug 2019 | 9 |
| Jul 2019 | 8 |
| Jun 2019 | 6 |
| May 2019 | 8 |
| Apr 2019 | 5 |
| Mar 2019 | 7 |
| Feb 2019 | 4 |
| Jan 2019 | 6 |
| Dec 2018 | 4 |
| Nov 2018 | 8 |
| Oct 2018 | 8 |
| Sep 2018 | 7 |
| Aug 2018 | 9 |
| Jul 2018 | 6 |
| Jun 2018 | 11 |
| May 2018 | 1 |
| Apr 2018 | 5 |
| Mar 2018 | 8 |
| Feb 2018 | 3 |
| Jan 2018 | 1 |
| Dec 2017 | 4 |
| Nov 2017 | 5 |
| Oct 2017 | 2 |
| Sep 2017 | 3 |
| Aug 2017 | 3 |
| Jul 2017 | 9 |
| Jun 2017 | 5 |
| May 2017 | 6 |
| Apr 2017 | 2 |
| Mar 2017 | 4 |
| Feb 2017 | 1 |
| Jan 2017 | 2 |
Source: HDB (via data.gov.sg). Data to Sep 2026.
Propwise’s view for Q4 2026 and 2027
This section is Propwise’s view, based on the data above. It is not a forecast you should bet a mortgage on: forecasters rarely call turning points.
For Q4 2026, we expect private prices to be flat to +1% and HDB resale prices to move within half a percent either way.
| Scenario for 2027 | What has to happen | Private prices | HDB resale prices |
|---|---|---|---|
| Base case (most likely) | SORA stays at 1–2%, growth slows but stays positive, new supply is absorbed slowly | +1% to +4% | −2% to +1% |
| Upside | Rates stay near today’s level, en bloc rules start and trigger a wave of sales, strong jobs market | +5% to +8% | +1% to +3% |
| Downside | Global recession or an inflation scare pushes SORA above 3% and unemployment up | −5% to −10% | −3% to −6% |
Why the base case: low rates and a strong economy support prices, but record land supply, the 2027–28 completion wave, unchanged cooling measures and flat HDB prices hold them back. Volumes should stay well below the 2021–22 boom.
The upside case has a ceiling. In July 2018, when private prices had risen 9.1% in a year, the Government responded by raising ABSD and cutting loan limits. A return to that pace would probably bring new measures.
The downside case has history behind it. The URA index fell 24.9% in four quarters in 2008–09 and 11.6% over 15 quarters in 2013–17. Our full list of past falls is in do Singapore property prices always go up?
The risks that would change our view
- A rate shock. If inflation forces global rates up, SORA could move back above 3%. A 3.5% rate adds about 26% to the instalment in our example, compared with a 1.75% floating rate.
- A global or trade downturn. Job losses create forced sellers. That, more than rates, is what caused past crashes. See why unemployment is the real killer.
- The supply wave. About 25,900 private units complete by 2028. If vacancy climbs well above today’s 6.4%, rents and investor returns fall first, then resale prices.
- Policy, both ways. New cooling measures if prices run, or a burst of en bloc activity once the new law starts.
- A widening HDB–private gap. Rising private prices and falling HDB prices make upgrading harder and shrink the buyer pool for mass-market condos.
What this means for you
- Buying a home to live in: buy on affordability, not on the outlook. Make sure you can pay the instalment at 4% and that you will stay at least four years, because selling earlier means SSD of up to 16%.
- Upgrading from HDB: do not assume your flat will rise. Price your sale on recent transactions, and check the ABSD timeline if you buy before you sell.
- Investing: a citizen pays 20% ABSD on a second home, so the property must rise more than 20% before you break even. Read is property still a good investment? before you commit.
- Selling: with a large pipeline coming, competitive pricing beats waiting for a better market. For timing questions, see is now a good time to buy?
Bottom line
The Singapore property market enters 2027 in a slow grind: record private prices, falling volumes, soft HDB resale prices, cheap mortgages and a lot of supply on the way. Our base case is small gains for private homes and flat HDB prices. The thing to watch is interest rates. If the Fed’s September hike is the start of a new cycle, today’s cheap loans are the biggest thing that could change.