Should You Believe Property Market Forecasts? (2026)
Singapore's private price index has swung from −4.7% to +31.1% in a year. Why forecasts miss turning points, how to use them, and how to test seminar claims.
Treat property forecasts as scenarios, not predictions. Since 2005 the URA private price index has moved anywhere from −4.7% to +31.1% in a single year, and a forecast of “a modest rise” would have held in only about half of those years. Use forecasts to learn what drives prices and what could go wrong, then make decisions you can survive if the forecast is wrong.
For our own scenarios, see the 2026 market outlook. This article explains how far to trust any outlook, ours included.
At a glance
- From 2005 to 2025 the private index changed by between −4.7% and +31.1% a year. Four years were negative and four years moved by more than 10%.
- A forecast range of −2% to +6% would have been right in only 10 of the 21 years.
- Simply repeating last year’s change would have missed by 6.8 points on average.
- Turning points are the hard part: the 2008 fall followed a 31% rise, and the 2014 fall followed four years of gains.
- The same caution applies to seminar claims. Four common ones fail against Singapore’s lending and stamp duty rules.
What 21 years of data shows
We tested how hard the job is. Using the URA private price index, we measured the change from Q4 to Q4 for each year from 2005 to 2025 (current series).
| Year | Actual change | Previous year’s change | Miss if you “repeat last year” |
|---|---|---|---|
| 2007 | +31.1% | +10.2% | 21.0 pts |
| 2008 | −4.7% | +31.1% | 35.8 pts |
| 2010 | +17.6% | +1.7% | 15.8 pts |
| 2014 | −4.0% | +1.1% | 5.2 pts |
| 2018 | +7.9% | +1.1% | 6.8 pts |
| 2021 | +10.6% | +2.2% | 8.4 pts |
Across all 21 years the “repeat last year” rule missed by 6.8 points on average. The direction (up or down) changed in 4 years. Even a flat “+3% every year” guess missed by 5.3 points on average. Where annual swings are this large, a forecast of “+1% to +4%” is a view about the middle of a very wide range.
- Policy measures (select one for details)
Latest: Private 3% (Q3 2026).
Change on the URA price index: each final quarter against the same quarter a year earlier. Markers are major measures from our policy timeline, not causes.
Table view
| Period | Private homes (change on a year earlier) |
|---|---|
| Q3 2026 | 3% |
| Q2 2026 | 3% |
| Q1 2026 | 3% |
| Q4 2025 | 3% |
| Q3 2025 | 5% |
| Q2 2025 | 3% |
| Q1 2025 | 3% |
| Q4 2024 | 4% |
| Q3 2024 | 4% |
| Q2 2024 | 6% |
| Q1 2024 | 5% |
| Q4 2023 | 7% |
| Q3 2023 | 4% |
| Q2 2023 | 7% |
| Q1 2023 | 11% |
| Q4 2022 | 9% |
| Q3 2022 | 14% |
| Q2 2022 | 11% |
| Q1 2022 | 8% |
| Q4 2021 | 11% |
| Q3 2021 | 7% |
| Q2 2021 | 7% |
| Q1 2021 | 7% |
| Q4 2020 | 2% |
| Q3 2020 | 1% |
| Q2 2020 | 1% |
| Q1 2020 | 2% |
| Q4 2019 | 3% |
| Q3 2019 | 2% |
| Q2 2019 | 1% |
| Q1 2019 | 3% |
| Q4 2018 | 8% |
| Q3 2018 | 9% |
| Q2 2018 | 9% |
| Q1 2018 | 5% |
| Q4 2017 | 1% |
| Q3 2017 | -0% |
| Q2 2017 | -2% |
| Q1 2017 | -3% |
| Q4 2016 | -3% |
| Q3 2016 | -3% |
| Q2 2016 | -3% |
| Q1 2016 | -3% |
| Q4 2015 | -4% |
| Q3 2015 | -4% |
| Q2 2015 | -4% |
| Q1 2015 | -4% |
| Q4 2014 | -4% |
| Q3 2014 | -4% |
| Q2 2014 | -3% |
| Q1 2014 | -1% |
| Q4 2013 | 1% |
| Q3 2013 | 4% |
| Q2 2013 | 4% |
| Q1 2013 | 4% |
| Q4 2012 | 3% |
| Q3 2012 | 1% |
| Q2 2012 | 2% |
| Q1 2012 | 3% |
| Q4 2011 | 6% |
| Q3 2011 | 8% |
| Q2 2011 | 10% |
| Q1 2011 | 14% |
| Q4 2010 | 18% |
| Q3 2010 | 23% |
| Q2 2010 | 38% |
| Q1 2010 | 25% |
| Q4 2009 | 2% |
| Q3 2009 | -11% |
| Q2 2009 | -25% |
| Q1 2009 | -21% |
| Q4 2008 | -5% |
| Q3 2008 | 8% |
| Q2 2008 | 20% |
| Q1 2008 | 30% |
| Q4 2007 | 31% |
| Q3 2007 | 28% |
| Q2 2007 | 21% |
| Q1 2007 | 14% |
| Q4 2006 | 10% |
| Q3 2006 | 8% |
| Q2 2006 | 6% |
| Q1 2006 | 5% |
| Q4 2005 | 4% |
| Q3 2005 | 3% |
| Q2 2005 | 2% |
| Q1 2005 | 2% |
| Q4 2004 | 1% |
| Q3 2004 | 0% |
| Q2 2004 | -1% |
| Q1 2004 | -2% |
| Q4 2003 | -2% |
| Q3 2003 | -2% |
| Q2 2003 | -1% |
| Q1 2003 | -1% |
| Q4 2002 | -2% |
| Q3 2002 | -6% |
| Q2 2002 | -9% |
| Q1 2002 | -9% |
| Q4 2001 | -12% |
| Q3 2001 | -10% |
| Q2 2001 | -10% |
| Q1 2001 | -8% |
| Q4 2000 | -1% |
| Q3 2000 | 7% |
| Q2 2000 | 19% |
| Q1 2000 | 31% |
| Q4 1999 | 34% |
| Q3 1999 | 16% |
| Q2 1999 | -6% |
| Q1 1999 | -23% |
| Q4 1998 | -34% |
| Q3 1998 | -31% |
| Q2 1998 | -24% |
| Q1 1998 | -18% |
| Q4 1997 | -12% |
| Q3 1997 | -11% |
| Q2 1997 | -9% |
| Q1 1997 | -3% |
| Q4 1996 | 5% |
| Q3 1996 | 13% |
| Q2 1996 | 17% |
| Q1 1996 | 11% |
| Q4 1995 | 10% |
| Q3 1995 | 8% |
| Q2 1995 | 19% |
| Q1 1995 | 34% |
| Q4 1994 | 42% |
| Q3 1994 | 47% |
| Q2 1994 | 44% |
| Q1 1994 | 41% |
| Q4 1993 | 36% |
| Q3 1993 | 32% |
| Q2 1993 | 25% |
| Q1 1993 | 17% |
| Q4 1992 | 16% |
| Q3 1992 | 15% |
| Q2 1992 | 14% |
| Q1 1992 | 19% |
| Q4 1991 | 18% |
| Q3 1991 | 11% |
| Q2 1991 | 9% |
| Q1 1991 | 3% |
Policy measures marked on this chart (26)
- 2025-07-03 Seller's Stamp Duty holding period back to four years, rates raised by 4 pp
- 2024-08-19 HDB loan LTV cut to 75% and Enhanced CPF Housing Grant raised
- 2023-04-26 ABSD rates raised, April 2023
- 2023-02-14 CPF Housing Grant raised for first-time resale buyers, Budget 2023
- 2023-02-14 Buyer's Stamp Duty raised for higher-value properties, Budget 2023
- 2022-09-29 Property measures, September 2022: higher TDSR and MSR rate floor, HDB loan LTV 80%, 15-month wait-out
- 2021-12-15 Property cooling measures, December 2021: higher ABSD, TDSR 55%, HDB loan LTV 85%
- 2018-07-05 Property cooling measures, July 2018: higher ABSD and lower LTV limits
- 2018-02-19 Budget 2018: Proximity Housing Grant enhanced
- 2018-02-19 Budget 2018: top BSD rate raised to 4% above S$1m
- 2017-03-10 SSD holding period cut to 3 years; TDSR relaxed for equity withdrawal
- 2013-08-27 HDB loan and resale measures, August 2013
- 2013-06-28 MAS introduces the Total Debt Servicing Ratio (TDSR) framework
- 2013-01-11 Property cooling measures, January 2013
- 2012-10-05 Maximum loan tenure of 35 years and tighter LTV limits, October 2012
- 2011-12-07 Additional Buyer's Stamp Duty introduced, December 2011
- 2011-01-13 Property cooling measures, January 2011
- 2010-08-30 HDB measures after National Day Rally 2010: DBSS income ceiling, 5-year MOP for non-subsidised flats
- 2010-08-30 Property cooling measures, August 2010
- 2010-02-19 Seller's Stamp Duty introduced and LTV limit cut to 80%, February 2010
- 2009-09-14 Interest-only loans and Interest Absorption Scheme disallowed, September 2009
- 2005-07-19 Property policy review, July 2005: LTV limit raised to 90%, CPF housing rules eased, foreign ownership rules eased
- 2001-10-12 Second off-budget package, October 2001: property tax rebate, stamp duty cut, gains tax removed, land sales eased
- 1998-06-29 Off-budget property measures, June 1998: land sales suspended, stamp duty deferred
- 1997-11-18 Property relief, November 1997: seller's stamp duty suspended, land sales deferred
- 1996-05-14 Anti-speculation measures, May 1996: seller's stamp duty, tax on short-term gains, 80% loan limit
Source: URA. Data to Q3 2026.
The big falls came from shocks that nobody could date. The index fell 24.9% between Q2 2008 and Q2 2009, in the global financial crisis. It then fell 11.6% from Q3 2013 to Q2 2017, a slow slide over 15 quarters. Policy can also change overnight. A citizen’s ABSD on a second home went from 12% to 17% in December 2021 and to 20% in April 2023, and the Seller’s Stamp Duty holding period went from three to four years in July 2025. No forecast made a year earlier could have priced those in.
- 1December 2021ABSD on a second home: 12% to 17%For a Singapore citizen.
- 2April 2023ABSD on a second home: 17% to 20%For a Singapore citizen.
- 3July 2025SSD holding period: three years to fourSeller's Stamp Duty now applies if you sell within four years.
Source: MND, measures to cool the property market (December 2021); MND, measures for a sustainable property market (April 2023); MAS, SSD holding period extension (July 2025).
Why a forecast matters less than your holding power
Here is a worked example with made-up numbers. Say you buy a S$1.5m condo and put down 25%, which is S$375,000. A forecast says prices rise 1% to 4% next year, so you buy. If instead prices fall 10% (the downside case in our outlook), the paper loss is S$150,000. That is 40% of your down payment, and it ignores stamp duty and fees.
S$
Source: Propwise worked example (loan rule: MAS) (October 2026). The paper loss is 40% of the down payment, and it ignores stamp duty and fees.
You need to know that you can keep paying the loan through a bad year. That is why banks test your loan at a rate of at least 4%, whatever the market rate is. Try your own numbers in our mortgage calculator. For the case where jobs fail, read why unemployment is the real killer.
How to use a forecast
- Ask for the assumptions. A good forecast says what it assumes for rates, supply and jobs.
- Look for a range and a downside. A single number with no risks is a sales pitch. Ours gives base, upside and downside cases.
- Check who gains if you act. Agents and developers are paid when a deal completes, and banks when you borrow. Check their numbers against URA’s.
- Prefer data you can verify. Vacancy, rents and completions are public. See why demand and supply matter.
- Plan for being wrong. Keep cash reserves and a loan you can afford at 4%.
Four seminar claims, checked against 2026 rules
Free property seminars often promise more than the rules allow. Four claims come up again and again.
“Own property in many countries.” Each country has its own taxes, laws and ways of valuing property, and diversifying across borders does not protect you from a global downturn. If a speaker is selling overseas property, look up their name on the CEA Public Register. CEA says it regulates estate agency work for properties in and outside Singapore. Our overseas property checklist has the questions to ask.
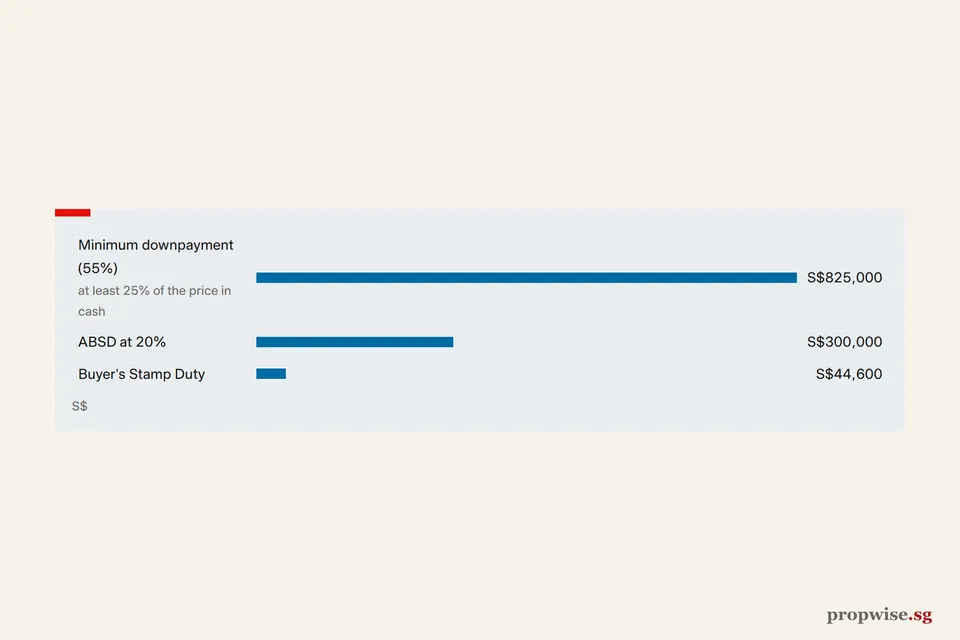
“Buy with little or no money down.” In Singapore the rules block this. Under the MAS loan-to-value limits, a second housing loan is capped at 45% of the price, with at least 25% of the price in cash. Say a Singapore citizen buys a second S$1.5m home. The down payment is 55%, or S$825,000, of which at least S$375,000 is cash. On top comes ABSD at 20%, which is S$300,000, and BSD of S$44,600. The total is S$1,169,600 before legal fees. See also buying with no money down.
S$
Source: MAS, loan tenure and loan-to-value limits (October 2026); IRAS, ABSD; IRAS, BSD. A second housing loan is capped at 45% of the price, so the down payment is 55%. At least S$375,000 of it must be cash.
“Below-market deals are everywhere.” They are rare. Check any “bargain” against recent sales in the same project, using URA’s free transaction search, which covers the last 60 months. Our guide on real and fake bargains lists six questions.
“Anyone can get rich with our course.” In the second-home example, ABSD and BSD add S$344,600, or 23% of the price. The home must rise about 23% before you recover the stamp duty, before loan interest, other costs and any Seller’s Stamp Duty (up to 16% if sold within a year). A course fee is the smaller cost. Read the property investment myths and the scam checklist.
Propwise’s view
Forecasts are useful for explaining drivers and weak for timing. We would not buy or sell on one, ours included. The risk in this view is the opposite error: ignoring all outlooks and missing a real shift in policy or rates. The answer is to track the drivers (rates, supply, jobs, policy) yourself and to size your purchase for a bad year.
Bottom line
Property forecasts have to cover a market that has moved by −4.7% to +31.1% in a year. Use them for the reasoning, not the number. Stress-test your loan, check seminar claims against the rules, and buy only what you can hold through a fall.