Is It a Good Time to Buy Property in Singapore? (2026)
When to buy property in Singapore: the latest price signals, what waiting costs, how 2019 HDB buyers fared, and the personal tests that beat timing.
For a home you will live in, the right time to buy is when your finances are ready and you find a fair price. In Q3 2026, private home prices rose 1.4% quarter-on-quarter and HDB resale prices fell 0.1%. Loans are cheap and new supply is large, so the market gives no clear signal either way.
At a glance
- Nobody times the market reliably. A buyer at the 2013 private price peak waited seven years to break even and is now about 44% up on paper.
- Waiting has a cost. In our example, renting for two years instead of buying costs about S$37,000 more. The same home must be about 2.5% cheaper two years later for the wait to pay.
- The latest picture (Q3 2026): private prices +1.4% and HDB resale -0.1% quarter-on-quarter, 3-month SORA at 1.36% and record land supply.
- Personal tests matter more than timing: can you pay at 4%, hold for at least four years and get through six months without income?
- Investors are different. With 20% ABSD on a second home, the entry price matters far more.
Why is timing the property market so hard?
Property prices move in cycles: a strong rise, a slower rise near the peak, a fall, then a flat stretch near the bottom. The pattern is easy to see in hindsight on the URA price index. In real time it is hard to see, for four reasons:
- The data lag. URA’s flash estimate comes out on the first day after the quarter, and the final figures about three weeks later. By then the market has moved on.
- Policy interrupts cycles. Cooling measures in 2013, 2018, 2021, 2022 and 2023 cut short several upswings. Every measure is on our policy timeline.
- Shocks arrive unannounced. The 2008 crisis took prices down 25% in a year. The 2020 pandemic, which many expected to cause a crash, left prices higher a year later.
- Recoveries vary. The index took 2 years to regain its 2008 peak and 14 years to regain its 1996 peak. See our analysis of whether prices always go up.
The chart shows the private price index since 1990, with the major policy measures marked.
- Policy measures (select one for details)
Latest: Private 222.5 (Q3 2026), up 3.4% on Q3 2025.
The index is a market average, not the price of any single home. Marked policy measures are shown for context only.
Table view
| Period | Private homes (URA price index) |
|---|---|
| Q3 2026 | 222.5 |
| Q2 2026 | 219.4 |
| Q1 2026 | 218.3 |
| Q4 2025 | 216.4 |
| Q3 2025 | 215.1 |
| Q2 2025 | 213.2 |
| Q1 2025 | 211.1 |
| Q4 2024 | 209.4 |
| Q3 2024 | 204.7 |
| Q2 2024 | 206.1 |
| Q1 2024 | 204.3 |
| Q4 2023 | 201.5 |
| Q3 2023 | 196.0 |
| Q2 2023 | 194.4 |
| Q1 2023 | 194.8 |
| Q4 2022 | 188.6 |
| Q3 2022 | 187.8 |
| Q2 2022 | 180.9 |
| Q1 2022 | 174.8 |
| Q4 2021 | 173.6 |
| Q3 2021 | 165.3 |
| Q2 2021 | 163.5 |
| Q1 2021 | 162.2 |
| Q4 2020 | 157.0 |
| Q3 2020 | 153.8 |
| Q2 2020 | 152.6 |
| Q1 2020 | 152.1 |
| Q4 2019 | 153.6 |
| Q3 2019 | 152.8 |
| Q2 2019 | 150.8 |
| Q1 2019 | 148.6 |
| Q4 2018 | 149.6 |
| Q3 2018 | 149.7 |
| Q2 2018 | 149.0 |
| Q1 2018 | 144.1 |
| Q4 2017 | 138.7 |
| Q3 2017 | 137.6 |
| Q2 2017 | 136.6 |
| Q1 2017 | 136.7 |
| Q4 2016 | 137.2 |
| Q3 2016 | 137.9 |
| Q2 2016 | 140.0 |
| Q1 2016 | 140.6 |
| Q4 2015 | 141.6 |
| Q3 2015 | 142.3 |
| Q2 2015 | 144.2 |
| Q1 2015 | 145.5 |
| Q4 2014 | 147.0 |
| Q3 2014 | 148.6 |
| Q2 2014 | 149.7 |
| Q1 2014 | 151.3 |
| Q4 2013 | 153.2 |
| Q3 2013 | 154.6 |
| Q2 2013 | 154.0 |
| Q1 2013 | 152.4 |
| Q4 2012 | 151.5 |
| Q3 2012 | 148.8 |
| Q2 2012 | 147.9 |
| Q1 2012 | 147.2 |
| Q4 2011 | 147.4 |
| Q3 2011 | 147.0 |
| Q2 2011 | 145.1 |
| Q1 2011 | 142.3 |
| Q4 2010 | 139.2 |
| Q3 2010 | 135.5 |
| Q2 2010 | 131.7 |
| Q1 2010 | 125.1 |
| Q4 2009 | 118.4 |
| Q3 2009 | 110.3 |
| Q2 2009 | 95.3 |
| Q1 2009 | 100.0 |
| Q4 2008 | 116.4 |
| Q3 2008 | 123.9 |
| Q2 2008 | 126.9 |
| Q1 2008 | 126.7 |
| Q4 2007 | 122.1 |
| Q3 2007 | 114.4 |
| Q2 2007 | 105.6 |
| Q1 2007 | 97.6 |
| Q4 2006 | 93.1 |
| Q3 2006 | 89.6 |
| Q2 2006 | 87.3 |
| Q1 2006 | 85.8 |
| Q4 2005 | 84.5 |
| Q3 2005 | 83.3 |
| Q2 2005 | 82.3 |
| Q1 2005 | 81.9 |
| Q4 2004 | 81.3 |
| Q3 2004 | 80.7 |
| Q2 2004 | 80.4 |
| Q1 2004 | 80.3 |
| Q4 2003 | 80.6 |
| Q3 2003 | 80.7 |
| Q2 2003 | 81.1 |
| Q1 2003 | 81.6 |
| Q4 2002 | 82.3 |
| Q3 2002 | 82.6 |
| Q2 2002 | 82.2 |
| Q1 2002 | 82.8 |
| Q4 2001 | 83.8 |
| Q3 2001 | 87.6 |
| Q2 2001 | 90.3 |
| Q1 2001 | 91.1 |
| Q4 2000 | 94.9 |
| Q3 2000 | 97.6 |
| Q2 2000 | 100.4 |
| Q1 2000 | 98.9 |
| Q4 1999 | 95.9 |
| Q3 1999 | 91.1 |
| Q2 1999 | 84.3 |
| Q1 1999 | 75.4 |
| Q4 1998 | 71.5 |
| Q3 1998 | 78.3 |
| Q2 1998 | 90.1 |
| Q1 1998 | 98.3 |
| Q4 1997 | 108.4 |
| Q3 1997 | 113.0 |
| Q2 1997 | 118.2 |
| Q1 1997 | 119.2 |
| Q4 1996 | 123.7 |
| Q3 1996 | 127.2 |
| Q2 1996 | 129.7 |
| Q1 1996 | 122.3 |
| Q4 1995 | 117.9 |
| Q3 1995 | 112.7 |
| Q2 1995 | 111.1 |
| Q1 1995 | 109.8 |
| Q4 1994 | 106.9 |
| Q3 1994 | 104.5 |
| Q2 1994 | 93.6 |
| Q1 1994 | 82.1 |
| Q4 1993 | 75.1 |
| Q3 1993 | 71.1 |
| Q2 1993 | 64.9 |
| Q1 1993 | 58.3 |
| Q4 1992 | 55.3 |
| Q3 1992 | 53.8 |
| Q2 1992 | 51.8 |
| Q1 1992 | 49.9 |
| Q4 1991 | 47.6 |
| Q3 1991 | 46.8 |
| Q2 1991 | 45.6 |
| Q1 1991 | 42.1 |
| Q4 1990 | 40.3 |
| Q3 1990 | 42.0 |
| Q2 1990 | 41.8 |
| Q1 1990 | 40.9 |
Policy measures marked on this chart (26)
- 2025-07-03 Seller's Stamp Duty holding period back to four years, rates raised by 4 pp
- 2024-08-19 HDB loan LTV cut to 75% and Enhanced CPF Housing Grant raised
- 2023-04-26 ABSD rates raised, April 2023
- 2023-02-14 CPF Housing Grant raised for first-time resale buyers, Budget 2023
- 2023-02-14 Buyer's Stamp Duty raised for higher-value properties, Budget 2023
- 2022-09-29 Property measures, September 2022: higher TDSR and MSR rate floor, HDB loan LTV 80%, 15-month wait-out
- 2021-12-15 Property cooling measures, December 2021: higher ABSD, TDSR 55%, HDB loan LTV 85%
- 2018-07-05 Property cooling measures, July 2018: higher ABSD and lower LTV limits
- 2018-02-19 Budget 2018: Proximity Housing Grant enhanced
- 2018-02-19 Budget 2018: top BSD rate raised to 4% above S$1m
- 2017-03-10 SSD holding period cut to 3 years; TDSR relaxed for equity withdrawal
- 2013-08-27 HDB loan and resale measures, August 2013
- 2013-06-28 MAS introduces the Total Debt Servicing Ratio (TDSR) framework
- 2013-01-11 Property cooling measures, January 2013
- 2012-10-05 Maximum loan tenure of 35 years and tighter LTV limits, October 2012
- 2011-12-07 Additional Buyer's Stamp Duty introduced, December 2011
- 2011-01-13 Property cooling measures, January 2011
- 2010-08-30 HDB measures after National Day Rally 2010: DBSS income ceiling, 5-year MOP for non-subsidised flats
- 2010-08-30 Property cooling measures, August 2010
- 2010-02-19 Seller's Stamp Duty introduced and LTV limit cut to 80%, February 2010
- 2009-09-14 Interest-only loans and Interest Absorption Scheme disallowed, September 2009
- 2005-07-19 Property policy review, July 2005: LTV limit raised to 90%, CPF housing rules eased, foreign ownership rules eased
- 2001-10-12 Second off-budget package, October 2001: property tax rebate, stamp duty cut, gains tax removed, land sales eased
- 1998-06-29 Off-budget property measures, June 1998: land sales suspended, stamp duty deferred
- 1997-11-18 Property relief, November 1997: seller's stamp duty suspended, land sales deferred
- 1996-05-14 Anti-speculation measures, May 1996: seller's stamp duty, tax on short-term gains, 80% loan limit
Source: URA. Data to Q3 2026.
Here is what the cycle meant for buyers at three turning points, using the same index:
| If you bought at | Index then | Worst point after | Q3 2026 | Change to Q3 2026 |
|---|---|---|---|---|
| The Q3 2013 peak | 154.6 | 136.6 (Q2 2017), −11.6% | 222.5 | about +44% |
| The Q2 2017 trough | 136.6 | no lower | 222.5 | about +63% |
| The Q2 1996 peak | 129.7 | 71.5 (Q4 1998), −44.9% | 222.5 | about +72% after 30 years |
The 2013 buyer felt foolish for seven years and is now well ahead. The 2017 buyer did better, but nobody knew in 2017 that it was the bottom. Most forecasters miss the turning points.
What happened to people who bought in a falling market?
HDB buyers in 2019 are a real test. The HDB Resale Price Index had drifted down for six years, from 149.4 in Q2 2013 to 130.8 in Q2 2019, about 12% lower. Waiting looked sensible at the time.
| Town | Median, 2019 | Median, Oct 2025 to Sep 2026 | Change since 2019 |
|---|---|---|---|
| Toa Payoh | S$550,000 | S$1,000,000 | +82% |
| Sembawang | S$343,000 | S$600,000 | +75% |
| Bukit Batok | S$362,000 | S$630,000 | +74% |
| Clementi | S$484,000 | S$821,500 | +70% |
| Kallang/Whampoa | S$537,500 | S$905,000 | +68% |
| All towns | S$400,000 | S$630,000 | +58% |
| Bukit Panjang | S$388,000 | S$570,000 | +47% |
| Bishan | S$550,000 | S$788,000 | +43% |
| Jurong East | S$385,000 | S$548,000 | +42% |
| Queenstown | S$728,000 | S$1,028,000 | +41% |
| Bukit Merah | S$680,000 | S$935,000 | +38% |
Source: HDB (September 2026). A town median mixes older and newer flats, so it moves with the mix of flats sold as well as with prices.
Those who bought anyway did well. The island-wide 4-room median rose from S$400,000 in 2019 to S$630,000 in the 12 months to September 2026, about 58% higher. Each of the 23 towns with 100 or more 4-room resales in both periods is up by more than a third.
The lesson: the bottom looked like a dull, slipping market, and nobody rang a bell. Each town’s latest prices are on its HDB town page.
What does waiting really cost?
Many buyers wait for a fall, so it is worth putting a price on the wait. Here is a worked example, with the assumptions stated.
Say you can buy a S$1.5m condo to live in, with a 75% loan at a 1.75% floating rate. That is mid-range for packages after the September 2026 US rate rise, as reported by The Business Times and CNA. Or you rent a similar unit for S$4,500 a month and wait two years.
| Over two years | Buy now | Rent and wait |
|---|---|---|
| Rent paid | — | S$108,000 |
| Mortgage interest (principal is saving, so it is left out) | about S$38,400 | — |
| Owner-occupier property tax, on an assumed annual value of S$54,000 | about S$4,240 | — |
| Maintenance fees (assumed S$400 a month) | S$9,600 | — |
| Interest forgone on the S$375,000 downpayment, at the CPF OA rate of 2.50% | S$18,750 | — |
| Money you do not get back | about S$71,000 | S$108,000 |
S$ over two years
Source: The Business Times, mortgage rates after the Fed hike (2 October 2026); IRAS, property tax rates. Illustrative. Buying counts interest, property tax, maintenance and interest forgone on the downpayment, not principal. Waiting pays only if the same home is more than about 2.5% cheaper after two years.
Renting costs about S$37,000 more. So waiting pays only if the same home is more than about 2.5% cheaper two years later. If prices instead rise 3% a year, waiting costs about S$128,000.
At higher mortgage rates the gap narrows, because owning costs more. Run your own figures with our mortgage calculator, or weigh the wider choice in rent or buy. For own-stay buyers, the cost of waiting for a modest fall is often higher than it looks.
Is it a good time to buy now? The market signals
| Signal | Latest reading | What it suggests |
|---|---|---|
| Private prices | +1.4% quarter-on-quarter in Q3 2026 | Firm, rising slowly |
| HDB resale prices | -0.1% quarter-on-quarter in Q3 2026 | Soft; upgraders gain less from selling |
| Supply | 9,320 units on the 2026 GLS Confirmed List, EC units included | More choice in 2027 and 2028 |
| Mortgage rates | 3-month SORA 1.36%; floating packages about 1.5% to 1.8% (The Business Times) | Still cheap, though banks raised rates after the US rise in September |
| Rents and vacancy | Rents +1.3% quarter-on-quarter, vacancy 7.2% (Q3 2026) | Stable for now |
| Economy | Real GDP 5.9% year-on-year in Q2 2026 | Jobs supported; few forced sellers |
| Indicator | Latest | Change | Trend |
|---|---|---|---|
| URA private price index1Q2009 = 100 | 222.5 (Q3 2026) | +1.4% q/q in the Q3 2026 final; +3.4% y/y to Q3 2026 | Q4 2020 – Q3 2026 |
| Landed homes | 265.9 (Q3 2026) | +2.9% q/q in the Q3 2026 final | Q4 2020 – Q3 2026 |
| Non-landed: CCR / RCR / OCRTrend line: all non-landed homes | 162.0 / 226.2 / 277.3 | +0.3% / 0.0% / +2.3% q/q in the Q3 2026 final | Q4 2020 – Q3 2026 |
| New private home sales in the monthFrom developers, excluding ECs. Launch months swing a lot | 1,716 (Oct 2026) | -29.2% y/y | Nov 2023 – Oct 2026 |
| Private resales in the monthCaveats, excluding ECs | 1,041 (Oct 2026) | -20.0% y/y | Nov 2023 – Oct 2026 |
| HDB resale price index1Q2009 = 100 | 202.5 (Q3 2026 final) | -0.1% q/q; -0.6% y/y | Q4 2020 – Q3 2026 |
| HDB resale transactions in the month | 2,173 (Oct 2026) | +62.4% y/y | Nov 2023 – Oct 2026 |
| HDB resales at S$1 million or more in the month | 238 (Oct 2026) | +176.7% y/y | Nov 2023 – Oct 2026 |
| Private home vacancy rate | 7.2% (Q3 2026) | +0.8 pp on the quarter before | Q4 2020 – Q3 2026 |
| 3-month compounded SORA | 1.36% (13 Nov 2026) | +0.12 pp since 14 Oct 2026 | Oct 2024 – Nov 2026 |
| Bank home-loan packagesLate Sep to early Oct 2026 | Floating about 1.5–1.8%, fixed about 2.0–2.2% | Up after the 16 Sep US rate hike |
Source: URA, HDB, HDB resale transactions, MAS (SORA), The Business Times, 2 Oct 2026 (loan packages), CNA, 18 Sep 2026 (loan packages). Index levels and changes are from the official series; sales counts and HDB medians are from URA and HDB transaction data. Provisional (flash) figures are labelled as such. Each trend line shows the period written under it, scaled to its own range; the dot is the latest value.
This is neither a frenzy nor a fire sale. Gains are small, so there is no rush. There are also no signs of distress, so deep discounts are unlikely unless the economy turns.
Private sales volumes, below, show how busy the market is. Our outlook for Q4 2026 and 2027 and the Q3 2026 data day carry the detail.
- New sales (from developers)
- Resales
- Sub-sales
Latest: New 1,720 (Oct 2026), down 28.5% on Oct 2025; Resale 1,041 (Oct 2026), down 20.0% on Oct 2025; Sub-sale 24 (Oct 2026), down 68.8% on Oct 2025.
Counts are caveats, as in URA's own quarterly totals, not units. A month appears once it is complete: URA adds late-lodged caveats for about two weeks.
Table view
| Period | New sales (from developers) | Resales | Sub-sales |
|---|---|---|---|
| Oct 2026 | 1,720 | 1,041 | 24 |
| Sep 2026 | 296 | 1,214 | 41 |
| Aug 2026 | 167 | 1,186 | 47 |
| Jul 2026 | 734 | 1,277 | 45 |
| Jun 2026 | 163 | 1,257 | 59 |
| May 2026 | 438 | 1,216 | 72 |
| Apr 2026 | 1,539 | 1,298 | 51 |
| Mar 2026 | 1,265 | 1,119 | 45 |
| Feb 2026 | 247 | 1,118 | 45 |
| Jan 2026 | 459 | 982 | 58 |
| Dec 2025 | 196 | 1,084 | 59 |
| Nov 2025 | 324 | 1,108 | 67 |
| Oct 2025 | 2,405 | 1,301 | 77 |
| Sep 2025 | 240 | 1,340 | 62 |
| Aug 2025 | 2,120 | 1,309 | 87 |
| Jul 2025 | 905 | 1,280 | 72 |
| Jun 2025 | 268 | 1,143 | 79 |
| May 2025 | 286 | 1,159 | 69 |
| Apr 2025 | 634 | 1,379 | 87 |
| Mar 2025 | 708 | 1,408 | 112 |
| Feb 2025 | 1,567 | 1,177 | 96 |
| Jan 2025 | 1,056 | 1,057 | 94 |
| Dec 2024 | 198 | 1,164 | 109 |
| Nov 2024 | 2,485 | 1,227 | 92 |
| Oct 2024 | 691 | 1,296 | 123 |
| Sep 2024 | 357 | 1,229 | 99 |
| Aug 2024 | 192 | 1,299 | 117 |
| Jul 2024 | 539 | 1,325 | 108 |
| Jun 2024 | 217 | 1,019 | 137 |
| May 2024 | 209 | 1,390 | 123 |
| Apr 2024 | 278 | 1,405 | 158 |
| Mar 2024 | 711 | 1,087 | 102 |
| Feb 2024 | 151 | 885 | 128 |
| Jan 2024 | 292 | 881 | 123 |
| Dec 2023 | 139 | 856 | 150 |
| Nov 2023 | 760 | 975 | 141 |
| Oct 2023 | 196 | 980 | 150 |
| Sep 2023 | 210 | 875 | 117 |
| Aug 2023 | 360 | 1,071 | 141 |
| Jul 2023 | 1,349 | 1,022 | 118 |
| Jun 2023 | 261 | 988 | 91 |
| May 2023 | 984 | 1,120 | 107 |
| Apr 2023 | 843 | 1,013 | 96 |
| Mar 2023 | 450 | 1,291 | 116 |
| Feb 2023 | 391 | 868 | 70 |
| Jan 2023 | 373 | 594 | 48 |
| Dec 2022 | 162 | 786 | 60 |
| Nov 2022 | 238 | 909 | 60 |
| Oct 2022 | 284 | 1,044 | 74 |
| Sep 2022 | 949 | 1,313 | 68 |
| Aug 2022 | 419 | 1,220 | 90 |
| Jul 2022 | 802 | 1,188 | 68 |
| Jun 2022 | 460 | 1,321 | 71 |
| May 2022 | 1,276 | 1,340 | 54 |
| Apr 2022 | 608 | 1,530 | 46 |
| Mar 2022 | 650 | 1,335 | 52 |
| Feb 2022 | 535 | 944 | 34 |
| Jan 2022 | 612 | 1,078 | 41 |
| Dec 2021 | 640 | 1,532 | 62 |
| Nov 2021 | 1,468 | 1,618 | 47 |
| Oct 2021 | 892 | 1,609 | 39 |
Source: URA. Data to Oct 2026.
What are the signs of a peak or a bottom?
Older Propwise articles listed these, and they still hold.
Late-cycle warning signs:
- buyers paying record prices because they fear being priced out
- small units sold at very high prices per square foot (psf)
- rental yields below mortgage rates
- investors relying only on price growth
- new cooling measures
- everyone at dinner talking about property
Bottoming signs:
- double-digit price falls
- more forced and mortgagee sales
- property out of favour in the media
- cooling measures eased
- resale volumes recovering after a long fall
- rents holding steady while prices fall
Today’s market shows a few late-cycle features: prices at or near a record and yields only a little above loan rates. It shows none of the bottoming signs. That fits a market in the middle of its cycle, which is the least exciting place to be and the hardest to call.
When is the right time for you to buy?
These tests matter more than any forecast:
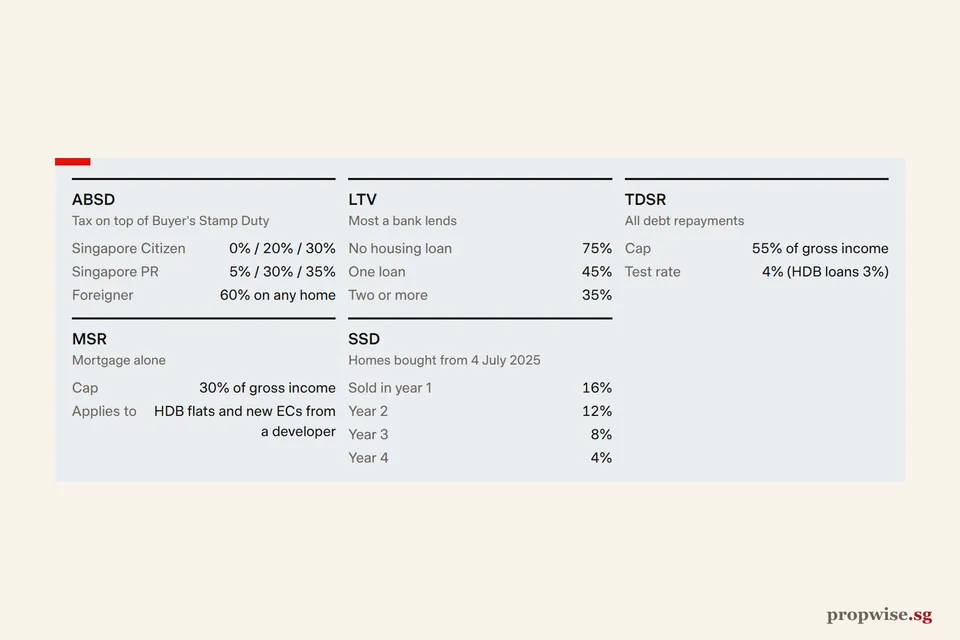
- Can you pay at 4%? Banks test you at that rate, the medium-term rate floor. A S$1.2m loan over 30 years costs S$5,729 a month at 4%. Under the 55% TDSR, that needs a gross income of about S$10,420 with no other debts (work out your own).
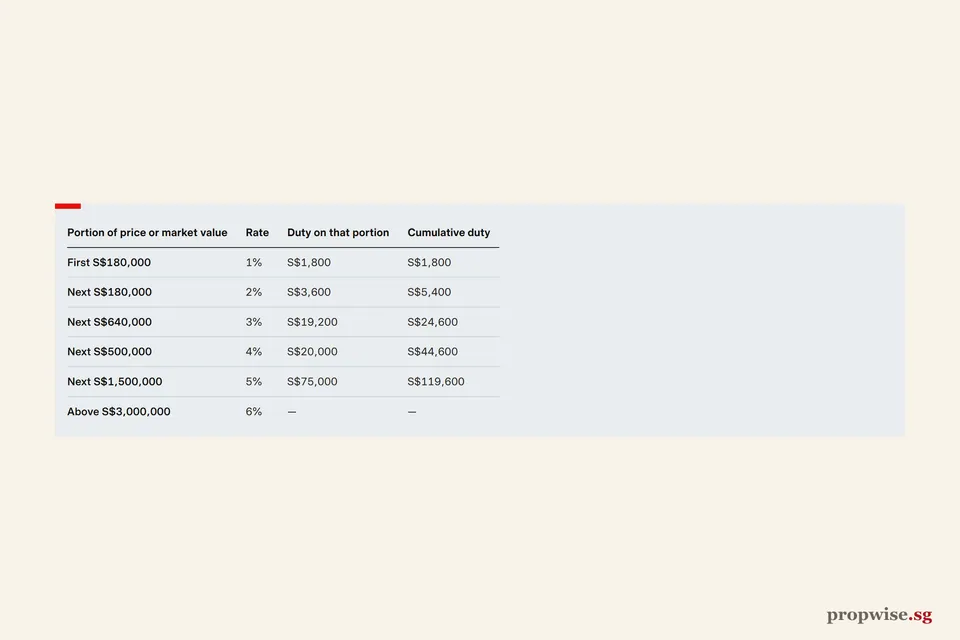
- Do you have the cash? You need at least 5% in cash for a first bank loan, the rest of the downpayment in cash or CPF, and Buyer’s Stamp Duty (S$32,600 on S$1.2m). Keep six months of instalments in reserve.
- Will you stay at least four years? Seller’s Stamp Duty of 16%, 12%, 8% or 4% applies if you sell a home bought from 4 July 2025 within four years.
- Is your job stable? A job loss is what turns a falling market into a forced sale. See why unemployment is the real killer.
- Is this the right property at a fair price? Check recent deals, the remaining lease and new supply nearby.
HDB buyers: the family income ceiling rose to S$16,000 from 24 August 2026. First-timer families buying resale can get grants of up to S$230,000. See when to buy a BTO flat.
Is it a good time to buy property as an investment?
For an investor, timing matters far more. A citizen buying a second home pays 20% Additional Buyer’s Stamp Duty (ABSD). The home must rise by more than that before a sale covers it, and buying near a peak can mean a decade of waiting.
An investor’s checks are stricter: a price below recent deals nearby, and a net yield that covers the loan at a higher rate. Our guide to whether property is still a good investment works through the numbers.
So, is now a good time to buy?
There is rarely a perfect time to buy, and waiting for one has a real cost. The market is stable and rising slowly, with cheap loans and plenty of supply on the way.
That makes it a reasonable time to buy a home if you pass the personal tests above, and a poor time to stretch. For investors, the 20% ABSD makes price discipline far more important than market timing.
Rules and rates as at 3 November 2026.