Q3 2026 Property Data: Condo Prices, Rents and Vacancy
URA's final Q3 2026 numbers: private home prices up 1.4%, rents up 1.3%, vacancy at 7.2%, and the HDB resale index slightly lower.
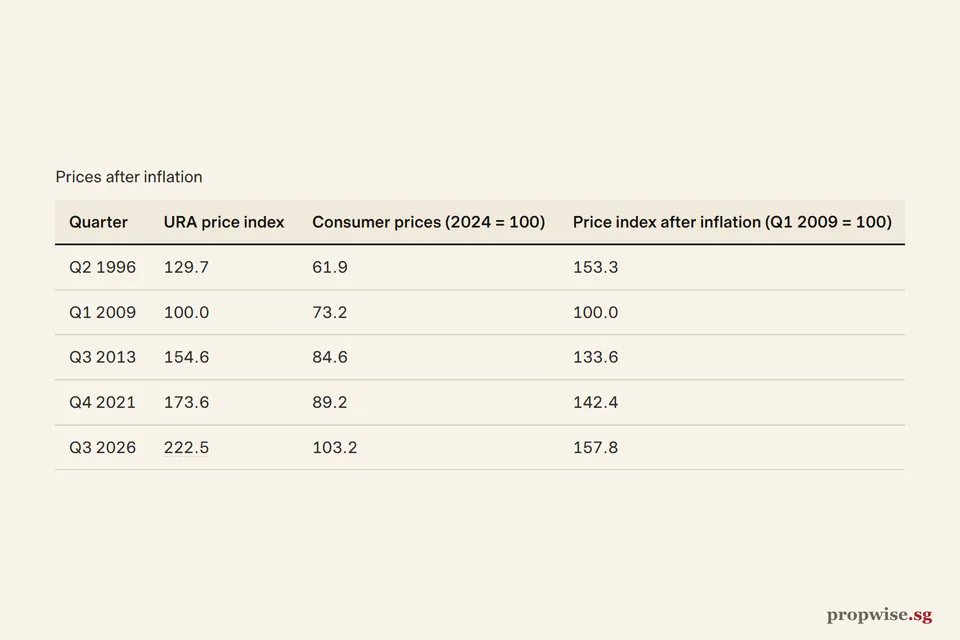
Private home prices rose 1.4% in the third quarter of 2026, according to the final URA figures released on 23 October. The index stands at 222.5, its highest level on record. The HDB Resale Price Index went the other way: it fell 0.1% to 202.5.
Private prices: landed and the suburbs led
- Policy measures (select one for details)
Latest: Private 222.5 (Q3 2026).
The index is a market average, not the price of any single home. Marked policy measures are shown for context only.
Table view
| Period | Private homes (URA price index) |
|---|---|
| Q3 2026 | 222.5 |
| Q2 2026 | 219.4 |
| Q1 2026 | 218.3 |
| Q4 2025 | 216.4 |
| Q3 2025 | 215.1 |
| Q2 2025 | 213.2 |
| Q1 2025 | 211.1 |
| Q4 2024 | 209.4 |
| Q3 2024 | 204.7 |
| Q2 2024 | 206.1 |
| Q1 2024 | 204.3 |
| Q4 2023 | 201.5 |
| Q3 2023 | 196.0 |
| Q2 2023 | 194.4 |
| Q1 2023 | 194.8 |
| Q4 2022 | 188.6 |
| Q3 2022 | 187.8 |
| Q2 2022 | 180.9 |
| Q1 2022 | 174.8 |
| Q4 2021 | 173.6 |
| Q3 2021 | 165.3 |
| Q2 2021 | 163.5 |
| Q1 2021 | 162.2 |
| Q4 2020 | 157.0 |
| Q3 2020 | 153.8 |
| Q2 2020 | 152.6 |
| Q1 2020 | 152.1 |
| Q4 2019 | 153.6 |
| Q3 2019 | 152.8 |
| Q2 2019 | 150.8 |
| Q1 2019 | 148.6 |
| Q4 2018 | 149.6 |
| Q3 2018 | 149.7 |
| Q2 2018 | 149.0 |
| Q1 2018 | 144.1 |
| Q4 2017 | 138.7 |
| Q3 2017 | 137.6 |
| Q2 2017 | 136.6 |
| Q1 2017 | 136.7 |
| Q4 2016 | 137.2 |
| Q3 2016 | 137.9 |
| Q2 2016 | 140.0 |
| Q1 2016 | 140.6 |
| Q4 2015 | 141.6 |
| Q3 2015 | 142.3 |
| Q2 2015 | 144.2 |
| Q1 2015 | 145.5 |
| Q4 2014 | 147.0 |
| Q3 2014 | 148.6 |
| Q2 2014 | 149.7 |
| Q1 2014 | 151.3 |
| Q4 2013 | 153.2 |
| Q3 2013 | 154.6 |
| Q2 2013 | 154.0 |
| Q1 2013 | 152.4 |
| Q4 2012 | 151.5 |
| Q3 2012 | 148.8 |
| Q2 2012 | 147.9 |
| Q1 2012 | 147.2 |
| Q4 2011 | 147.4 |
| Q3 2011 | 147.0 |
| Q2 2011 | 145.1 |
| Q1 2011 | 142.3 |
| Q4 2010 | 139.2 |
| Q3 2010 | 135.5 |
| Q2 2010 | 131.7 |
| Q1 2010 | 125.1 |
| Q4 2009 | 118.4 |
| Q3 2009 | 110.3 |
| Q2 2009 | 95.3 |
| Q1 2009 | 100.0 |
| Q4 2008 | 116.4 |
| Q3 2008 | 123.9 |
| Q2 2008 | 126.9 |
| Q1 2008 | 126.7 |
| Q4 2007 | 122.1 |
| Q3 2007 | 114.4 |
| Q2 2007 | 105.6 |
| Q1 2007 | 97.6 |
| Q4 2006 | 93.1 |
| Q3 2006 | 89.6 |
| Q2 2006 | 87.3 |
| Q1 2006 | 85.8 |
| Q4 2005 | 84.5 |
| Q3 2005 | 83.3 |
| Q2 2005 | 82.3 |
| Q1 2005 | 81.9 |
| Q4 2004 | 81.3 |
| Q3 2004 | 80.7 |
| Q2 2004 | 80.4 |
| Q1 2004 | 80.3 |
| Q4 2003 | 80.6 |
| Q3 2003 | 80.7 |
| Q2 2003 | 81.1 |
| Q1 2003 | 81.6 |
| Q4 2002 | 82.3 |
| Q3 2002 | 82.6 |
| Q2 2002 | 82.2 |
| Q1 2002 | 82.8 |
| Q4 2001 | 83.8 |
| Q3 2001 | 87.6 |
| Q2 2001 | 90.3 |
| Q1 2001 | 91.1 |
| Q4 2000 | 94.9 |
| Q3 2000 | 97.6 |
| Q2 2000 | 100.4 |
| Q1 2000 | 98.9 |
| Q4 1999 | 95.9 |
| Q3 1999 | 91.1 |
| Q2 1999 | 84.3 |
| Q1 1999 | 75.4 |
| Q4 1998 | 71.5 |
| Q3 1998 | 78.3 |
| Q2 1998 | 90.1 |
| Q1 1998 | 98.3 |
| Q4 1997 | 108.4 |
| Q3 1997 | 113.0 |
| Q2 1997 | 118.2 |
| Q1 1997 | 119.2 |
| Q4 1996 | 123.7 |
| Q3 1996 | 127.2 |
| Q2 1996 | 129.7 |
| Q1 1996 | 122.3 |
| Q4 1995 | 117.9 |
| Q3 1995 | 112.7 |
| Q2 1995 | 111.1 |
| Q1 1995 | 109.8 |
| Q4 1994 | 106.9 |
| Q3 1994 | 104.5 |
| Q2 1994 | 93.6 |
| Q1 1994 | 82.1 |
| Q4 1993 | 75.1 |
| Q3 1993 | 71.1 |
| Q2 1993 | 64.9 |
| Q1 1993 | 58.3 |
| Q4 1992 | 55.3 |
| Q3 1992 | 53.8 |
| Q2 1992 | 51.8 |
| Q1 1992 | 49.9 |
| Q4 1991 | 47.6 |
| Q3 1991 | 46.8 |
| Q2 1991 | 45.6 |
| Q1 1991 | 42.1 |
| Q4 1990 | 40.3 |
| Q3 1990 | 42.0 |
| Q2 1990 | 41.8 |
| Q1 1990 | 40.9 |
Policy measures marked on this chart (26)
- 2025-07-03 Seller's Stamp Duty holding period back to four years, rates raised by 4 pp
- 2024-08-19 HDB loan LTV cut to 75% and Enhanced CPF Housing Grant raised
- 2023-04-26 ABSD rates raised, April 2023
- 2023-02-14 CPF Housing Grant raised for first-time resale buyers, Budget 2023
- 2023-02-14 Buyer's Stamp Duty raised for higher-value properties, Budget 2023
- 2022-09-29 Property measures, September 2022: higher TDSR and MSR rate floor, HDB loan LTV 80%, 15-month wait-out
- 2021-12-15 Property cooling measures, December 2021: higher ABSD, TDSR 55%, HDB loan LTV 85%
- 2018-07-05 Property cooling measures, July 2018: higher ABSD and lower LTV limits
- 2018-02-19 Budget 2018: Proximity Housing Grant enhanced
- 2018-02-19 Budget 2018: top BSD rate raised to 4% above S$1m
- 2017-03-10 SSD holding period cut to 3 years; TDSR relaxed for equity withdrawal
- 2013-08-27 HDB loan and resale measures, August 2013
- 2013-06-28 MAS introduces the Total Debt Servicing Ratio (TDSR) framework
- 2013-01-11 Property cooling measures, January 2013
- 2012-10-05 Maximum loan tenure of 35 years and tighter LTV limits, October 2012
- 2011-12-07 Additional Buyer's Stamp Duty introduced, December 2011
- 2011-01-13 Property cooling measures, January 2011
- 2010-08-30 HDB measures after National Day Rally 2010: DBSS income ceiling, 5-year MOP for non-subsidised flats
- 2010-08-30 Property cooling measures, August 2010
- 2010-02-19 Seller's Stamp Duty introduced and LTV limit cut to 80%, February 2010
- 2009-09-14 Interest-only loans and Interest Absorption Scheme disallowed, September 2009
- 2005-07-19 Property policy review, July 2005: LTV limit raised to 90%, CPF housing rules eased, foreign ownership rules eased
- 2001-10-12 Second off-budget package, October 2001: property tax rebate, stamp duty cut, gains tax removed, land sales eased
- 1998-06-29 Off-budget property measures, June 1998: land sales suspended, stamp duty deferred
- 1997-11-18 Property relief, November 1997: seller's stamp duty suspended, land sales deferred
- 1996-05-14 Anti-speculation measures, May 1996: seller's stamp duty, tax on short-term gains, 80% loan limit
Source: URA. Data to Q3 2026.
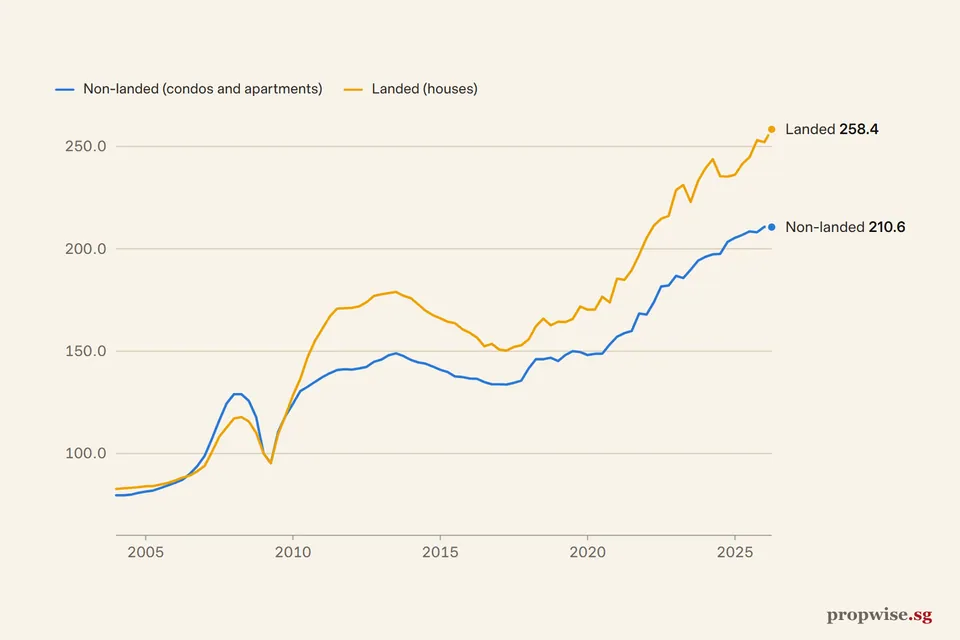
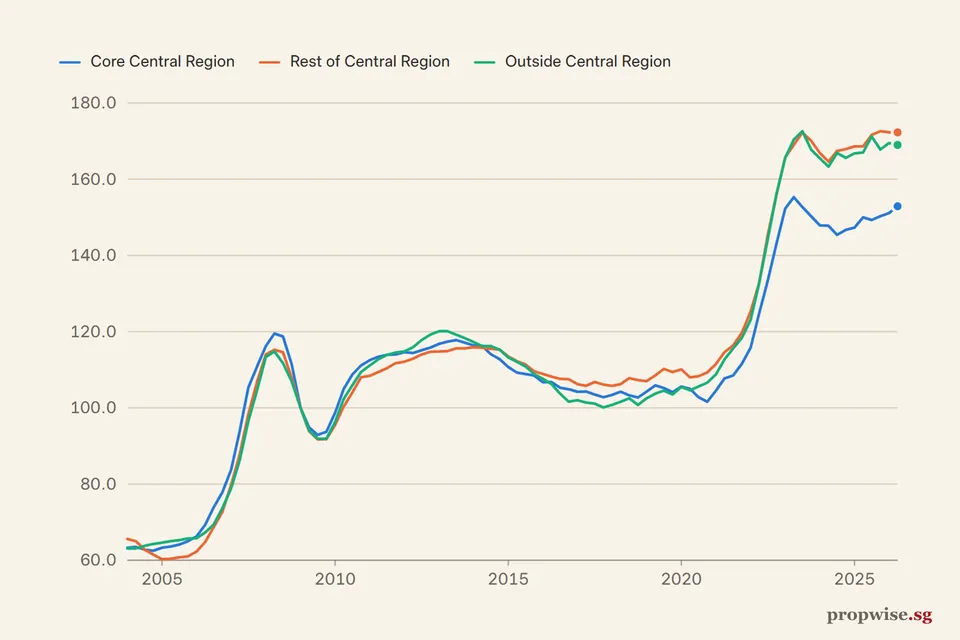
Landed homes rose 2.9% and condos 1.0%. Among condos, the Outside Central Region (OCR) rose 2.3%, the Core Central Region (CCR) rose 0.3% and the Rest of Central Region (RCR) stayed flat. URA’s 1 October flash estimate had the CCR slightly down and the RCR slightly up, so the final numbers moved a little in both.
| Segment | Change in Q3 2026 |
|---|---|
| All private homes | +1.4% |
| Landed | +2.9% |
| Condos | +1.0% |
| CCR | +0.3% |
| RCR | 0.0% |
| OCR | +2.3% |
Source: URA. Data to Q3 2026.
Landed homes and the suburbs carried the gain.
What is behind the rise
Fewer new homes sold, yet prices went up. Mark Yip, CEO of Huttons Asia, told EdgeProp that about 1,100 new homes sold in the quarter, the lowest third-quarter number since 1998. He pointed to the Lunar Seventh Month and uncertainty over the US-Iran truce.
Christine Sun, chief researcher at Realion Group, said the mix of sales did the work. Homes sold for S$2 million or more rose from 49.2% to 53.6% of private sales. Among new sales the share rose from 52.3% to 71.7%. When more of the homes sold are expensive ones, the average price rises even if no single home gets dearer.
Huttons also linked the OCR gain partly to higher benchmarks set by projects such as Vela Bay.
Rents and vacancy
Rents rose 1.3% to an index of 164.6. Vacancy moved the other way: 7.2% of private homes were empty at the end of Q3 2026, up from 6.4% the quarter before.
Latest: Vacancy 7.2% (Q3 2026).
Vacancy is calculated as vacant units divided by units available, using URA counts of completed private homes (landed and non-landed).
Table view
| Period | Private homes vacant (%) |
|---|---|
| Q3 2026 | 7.2% |
| Q2 2026 | 6.4% |
| Q1 2026 | 6.2% |
| Q4 2025 | 6.0% |
| Q3 2025 | 6.9% |
| Q2 2025 | 7.1% |
| Q1 2025 | 6.5% |
| Q4 2024 | 6.6% |
| Q3 2024 | 7.2% |
| Q2 2024 | 6.1% |
| Q1 2024 | 6.8% |
| Q4 2023 | 8.1% |
| Q3 2023 | 8.4% |
| Q2 2023 | 6.3% |
| Q1 2023 | 6.0% |
| Q4 2022 | 5.5% |
| Q3 2022 | 5.7% |
| Q2 2022 | 5.4% |
| Q1 2022 | 5.3% |
| Q4 2021 | 6.0% |
| Q3 2021 | 6.4% |
| Q2 2021 | 6.3% |
| Q1 2021 | 6.4% |
| Q4 2020 | 7.0% |
| Q3 2020 | 6.2% |
| Q2 2020 | 5.4% |
| Q1 2020 | 5.4% |
| Q4 2019 | 5.5% |
| Q3 2019 | 6.1% |
| Q2 2019 | 6.4% |
| Q1 2019 | 6.3% |
| Q4 2018 | 6.4% |
| Q3 2018 | 6.8% |
| Q2 2018 | 7.1% |
| Q1 2018 | 7.4% |
| Q4 2017 | 7.8% |
| Q3 2017 | 8.4% |
| Q2 2017 | 8.1% |
| Q1 2017 | 8.1% |
| Q4 2016 | 8.4% |
| Q3 2016 | 8.7% |
| Q2 2016 | 8.9% |
| Q1 2016 | 7.5% |
| Q4 2015 | 8.1% |
| Q3 2015 | 7.8% |
| Q2 2015 | 7.9% |
| Q1 2015 | 7.2% |
| Q4 2014 | 7.8% |
| Q3 2014 | 7.1% |
| Q2 2014 | 7.1% |
| Q1 2014 | 6.6% |
| Q4 2013 | 6.2% |
| Q3 2013 | 6.1% |
| Q2 2013 | 5.6% |
| Q1 2013 | 5.2% |
| Q4 2012 | 5.4% |
| Q3 2012 | 6.1% |
| Q2 2012 | 5.9% |
| Q1 2012 | 6.0% |
| Q4 2011 | 5.9% |
| Q3 2011 | 5.8% |
| Q2 2011 | 5.1% |
| Q1 2011 | 4.9% |
| Q4 2010 | 5.0% |
| Q3 2010 | 5.2% |
| Q2 2010 | 5.4% |
| Q1 2010 | 4.6% |
| Q4 2009 | 5.0% |
| Q3 2009 | 6.2% |
| Q2 2009 | 5.9% |
| Q1 2009 | 5.9% |
| Q4 2008 | 6.1% |
| Q3 2008 | 5.8% |
| Q2 2008 | 6.1% |
| Q1 2008 | 6.3% |
| Q4 2007 | 5.6% |
| Q3 2007 | 5.4% |
| Q2 2007 | 4.9% |
| Q1 2007 | 5.1% |
| Q4 2006 | 6.1% |
| Q3 2006 | 6.6% |
| Q2 2006 | 6.5% |
| Q1 2006 | 7.4% |
| Q4 2005 | 8.4% |
| Q3 2005 | 8.5% |
| Q2 2005 | 8.7% |
| Q1 2005 | 8.8% |
| Q4 2004 | 8.1% |
| Q3 2004 | 8.5% |
| Q2 2004 | 8.3% |
| Q1 2004 | 8.4% |
| Q4 2003 | 7.7% |
| Q3 2003 | 8.1% |
| Q2 2003 | 7.6% |
| Q1 2003 | 7.6% |
| Q4 2002 | 8.5% |
| Q3 2002 | 8.1% |
| Q2 2002 | 8.3% |
| Q1 2002 | 7.6% |
| Q4 2001 | 8.2% |
| Q3 2001 | 7.6% |
| Q2 2001 | 7.1% |
| Q1 2001 | 6.5% |
| Q4 2000 | 6.9% |
| Q3 2000 | 7.9% |
| Q2 2000 | 9.1% |
| Q1 2000 | 8.5% |
Source: URA. Data to Q3 2026.
URA counts 48,230 condos in the supply pipeline, meaning homes approved but not yet completed, at the end of the quarter.
HDB resale prices
- Policy measures (select one for details)
Latest: HDB 202.5 (Q3 2026).
HDB adjusts for the mix of flats sold: it used stratification up to 3Q2014 and a stratified hedonic regression from 4Q2014 (HDB, data.gov.sg). Quarters appear when HDB publishes the final figure.
Table view
| Period | HDB Resale Price Index |
|---|---|
| Q3 2026 | 202.5 |
| Q2 2026 | 202.8 |
| Q1 2026 | 203.4 |
| Q4 2025 | 203.6 |
| Q3 2025 | 203.7 |
| Q2 2025 | 202.9 |
| Q1 2025 | 201.0 |
| Q4 2024 | 197.9 |
| Q3 2024 | 192.9 |
| Q2 2024 | 187.9 |
| Q1 2024 | 183.7 |
| Q4 2023 | 180.4 |
| Q3 2023 | 178.5 |
| Q2 2023 | 176.2 |
| Q1 2023 | 173.6 |
| Q4 2022 | 171.9 |
| Q3 2022 | 168.1 |
| Q2 2022 | 163.9 |
| Q1 2022 | 159.5 |
| Q4 2021 | 155.7 |
| Q3 2021 | 150.6 |
| Q2 2021 | 146.4 |
| Q1 2021 | 142.2 |
| Q4 2020 | 138.1 |
| Q3 2020 | 133.9 |
| Q2 2020 | 131.9 |
| Q1 2020 | 131.5 |
| Q4 2019 | 131.5 |
| Q3 2019 | 130.9 |
| Q2 2019 | 130.8 |
| Q1 2019 | 131.0 |
| Q4 2018 | 131.4 |
| Q3 2018 | 131.6 |
| Q2 2018 | 131.7 |
| Q1 2018 | 131.6 |
| Q4 2017 | 132.6 |
| Q3 2017 | 132.8 |
| Q2 2017 | 133.7 |
| Q1 2017 | 133.9 |
| Q4 2016 | 134.6 |
| Q3 2016 | 134.7 |
| Q2 2016 | 134.7 |
| Q1 2016 | 134.7 |
| Q4 2015 | 134.8 |
| Q3 2015 | 134.6 |
| Q2 2015 | 135.0 |
| Q1 2015 | 135.6 |
Policy measures marked on this chart (11)
- 2025-07-03 Seller's Stamp Duty holding period back to four years, rates raised by 4 pp
- 2024-08-19 HDB loan LTV cut to 75% and Enhanced CPF Housing Grant raised
- 2023-04-26 ABSD rates raised, April 2023
- 2023-02-14 CPF Housing Grant raised for first-time resale buyers, Budget 2023
- 2023-02-14 Buyer's Stamp Duty raised for higher-value properties, Budget 2023
- 2022-09-29 Property measures, September 2022: higher TDSR and MSR rate floor, HDB loan LTV 80%, 15-month wait-out
- 2021-12-15 Property cooling measures, December 2021: higher ABSD, TDSR 55%, HDB loan LTV 85%
- 2018-07-05 Property cooling measures, July 2018: higher ABSD and lower LTV limits
- 2018-02-19 Budget 2018: Proximity Housing Grant enhanced
- 2018-02-19 Budget 2018: top BSD rate raised to 4% above S$1m
- 2017-03-10 SSD holding period cut to 3 years; TDSR relaxed for equity withdrawal
Source: HDB. Data to Q3 2026.
HDB’s index is 202.5, -0.6% on a year earlier. Private prices are still rising while HDB prices drift sideways, which widens the gap between the two markets. Our guide to the HDB Resale Price Index shows the last eight quarters.
The dashboard today
| Indicator | Latest | Change | Trend |
|---|---|---|---|
| URA private price index1Q2009 = 100 | 222.5 (Q3 2026) | +1.4% q/q in the Q3 2026 final; +3.4% y/y to Q3 2026 | Q4 2020 – Q3 2026 |
| Landed homes | 265.9 (Q3 2026) | +2.9% q/q in the Q3 2026 final | Q4 2020 – Q3 2026 |
| Non-landed: CCR / RCR / OCRTrend line: all non-landed homes | 162.0 / 226.2 / 277.3 | +0.3% / 0.0% / +2.3% q/q in the Q3 2026 final | Q4 2020 – Q3 2026 |
| New private home sales in the monthFrom developers, excluding ECs. Launch months swing a lot | 296 (Sep 2026) | +16.1% y/y | Oct 2023 – Sep 2026 |
| Private resales in the monthCaveats, excluding ECs | 1,170 (Sep 2026) | -12.7% y/y | Oct 2023 – Sep 2026 |
| HDB resale price index1Q2009 = 100 | 202.5 (Q3 2026 final) | -0.1% q/q; -0.6% y/y | Q4 2020 – Q3 2026 |
| HDB resale transactions in the month | 2,243 (Sep 2026) | +3.2% y/y | Oct 2023 – Sep 2026 |
| HDB resales at S$1 million or more in the month | 208 (Sep 2026) | +20.9% y/y | Oct 2023 – Sep 2026 |
| Private home vacancy rate | 7.2% (Q3 2026) | +0.8 pp on the quarter before | Q4 2020 – Q3 2026 |
| 3-month compounded SORA | 1.26% (22 Oct 2026) | +0.04 pp since 22 Sep 2026 | Oct 2024 – Oct 2026 |
| Bank home-loan packagesLate Sep to early Oct 2026 | Floating about 1.5–1.8%, fixed about 2.0–2.2% | Up after the 16 Sep US rate hike |
Source: URA, HDB, HDB resale transactions, MAS (SORA), The Business Times, 2 Oct 2026 (loan packages), CNA, 18 Sep 2026 (loan packages). Index levels and changes are from the official series; sales counts and HDB medians are from URA and HDB transaction data. Provisional (flash) figures are labelled as such. Each trend line shows the period written under it, scaled to its own range; the dot is the latest value.