Landed vs Condo Prices: 4 Reasons the Gap Widened Since 2009 (Q3 2026)
Landed prices are up 8.6% in a year and condo prices 2.0%. Four reasons the gap between them has widened since 2009, with charts.
Landed home prices have pulled well ahead of condo prices in URA’s index. In Q3 2026 the landed index stood at 265.9, up 8.6% on a year earlier. The non-landed index (condos and apartments) stood at 212.7, up 2.0%.
Both indices start from the same base, Q1 2009 = 100, so the gap shows which grew faster. They come from URA’s private residential price index, published quarterly via SingStat. The index adjusts for differences between the homes sold and excludes executive condominiums.
- Non-landed (condos and apartments)
- Landed (houses)
Latest: Non-landed 212.7 (Q3 2026), up 2.0% on Q3 2025; Landed 265.9 (Q3 2026), up 8.6% on Q3 2025.
Table view
| Period | Non-landed (condos and apartments) | Landed (houses) |
|---|---|---|
| Q3 2026 | 212.7 | 265.9 |
| Q2 2026 | 210.6 | 258.4 |
| Q1 2026 | 210.8 | 252.1 |
| Q4 2025 | 208.1 | 253.1 |
| Q3 2025 | 208.5 | 244.8 |
| Q2 2025 | 206.8 | 241.4 |
| Q1 2025 | 205.4 | 236.2 |
| Q4 2024 | 203.4 | 235.3 |
| Q3 2024 | 197.5 | 235.5 |
| Q2 2024 | 197.3 | 243.8 |
| Q1 2024 | 196.1 | 239.3 |
| Q4 2023 | 194.2 | 233.2 |
| Q3 2023 | 189.8 | 222.9 |
| Q2 2023 | 185.7 | 231.2 |
| Q1 2023 | 186.8 | 228.7 |
| Q4 2022 | 182.1 | 216.0 |
| Q3 2022 | 181.6 | 214.7 |
| Q2 2022 | 173.9 | 211.3 |
| Q1 2022 | 167.9 | 205.3 |
| Q4 2021 | 168.4 | 197.0 |
| Q3 2021 | 159.9 | 189.6 |
| Q2 2021 | 158.8 | 184.8 |
| Q1 2021 | 157.1 | 185.4 |
| Q4 2020 | 153.3 | 173.8 |
| Q3 2020 | 148.8 | 176.6 |
| Q2 2020 | 148.7 | 170.3 |
| Q1 2020 | 148.1 | 170.3 |
| Q4 2019 | 149.6 | 171.8 |
| Q3 2019 | 150.0 | 165.8 |
| Q2 2019 | 148.1 | 164.2 |
| Q1 2019 | 145.2 | 164.4 |
| Q4 2018 | 146.8 | 162.6 |
| Q3 2018 | 146.1 | 165.9 |
| Q2 2018 | 146.1 | 162.2 |
| Q1 2018 | 141.6 | 155.8 |
| Q4 2017 | 135.6 | 152.9 |
| Q3 2017 | 134.5 | 152.1 |
| Q2 2017 | 133.7 | 150.3 |
| Q1 2017 | 133.8 | 150.8 |
| Q4 2016 | 133.8 | 153.6 |
| Q3 2016 | 134.9 | 152.4 |
| Q2 2016 | 136.5 | 156.6 |
| Q1 2016 | 136.6 | 159.0 |
| Q4 2015 | 137.4 | 160.8 |
| Q3 2015 | 137.7 | 163.7 |
| Q2 2015 | 139.8 | 164.4 |
| Q1 2015 | 140.9 | 166.1 |
| Q4 2014 | 142.5 | 167.6 |
| Q3 2014 | 143.9 | 169.8 |
| Q2 2014 | 144.5 | 172.9 |
| Q1 2014 | 145.7 | 175.9 |
| Q4 2013 | 147.6 | 177.1 |
| Q3 2013 | 148.9 | 178.9 |
| Q2 2013 | 148.0 | 178.4 |
| Q1 2013 | 145.9 | 177.8 |
| Q4 2012 | 144.8 | 177.0 |
| Q3 2012 | 142.3 | 173.9 |
| Q2 2012 | 141.6 | 171.9 |
| Q1 2012 | 141.0 | 171.2 |
| Q4 2011 | 141.2 | 171.0 |
| Q3 2011 | 140.8 | 170.8 |
| Q2 2011 | 139.2 | 166.9 |
| Q1 2011 | 137.3 | 161.1 |
| Q4 2010 | 135.0 | 155.1 |
| Q3 2010 | 132.6 | 147.0 |
| Q2 2010 | 130.5 | 136.4 |
| Q1 2010 | 124.3 | 128.4 |
| Q4 2009 | 118.4 | 118.6 |
| Q3 2009 | 110.5 | 109.5 |
| Q2 2009 | 95.3 | 95.3 |
| Q1 2009 | 100.0 | 100.0 |
| Q4 2008 | 117.8 | 110.1 |
| Q3 2008 | 125.8 | 115.7 |
| Q2 2008 | 129.0 | 117.8 |
| Q1 2008 | 129.0 | 117.1 |
| Q4 2007 | 124.4 | 112.7 |
| Q3 2007 | 116.0 | 108.1 |
| Q2 2007 | 107.1 | 100.6 |
| Q1 2007 | 98.8 | 94.0 |
| Q4 2006 | 93.8 | 91.3 |
| Q3 2006 | 90.0 | 89.2 |
| Q2 2006 | 87.2 | 88.2 |
| Q1 2006 | 85.7 | 86.8 |
| Q4 2005 | 84.4 | 85.6 |
| Q3 2005 | 83.1 | 84.8 |
| Q2 2005 | 81.9 | 84.1 |
| Q1 2005 | 81.4 | 84.0 |
| Q4 2004 | 80.8 | 83.6 |
| Q3 2004 | 79.9 | 83.3 |
| Q2 2004 | 79.6 | 83.0 |
| Q1 2004 | 79.6 | 82.7 |
Source: URA. Data to Q3 2026.
The picture since 2004
From Q1 2004 to Q3 2026 (final figures, as at 23 October 2026) landed prices rose 221.5% and condo prices 167.2%.
| Index | Q1 2004 | Q3 2026 | Change |
|---|---|---|---|
| Landed | 82.7 | 265.9 | +221.5% |
| Non-landed | 79.6 | 212.7 | +167.2% |
Both indices set a record in Q3 2026, in a series that starts in 1975. The landed index rose 2.9% on the quarter and the non-landed index 1.0%.
When the lines split
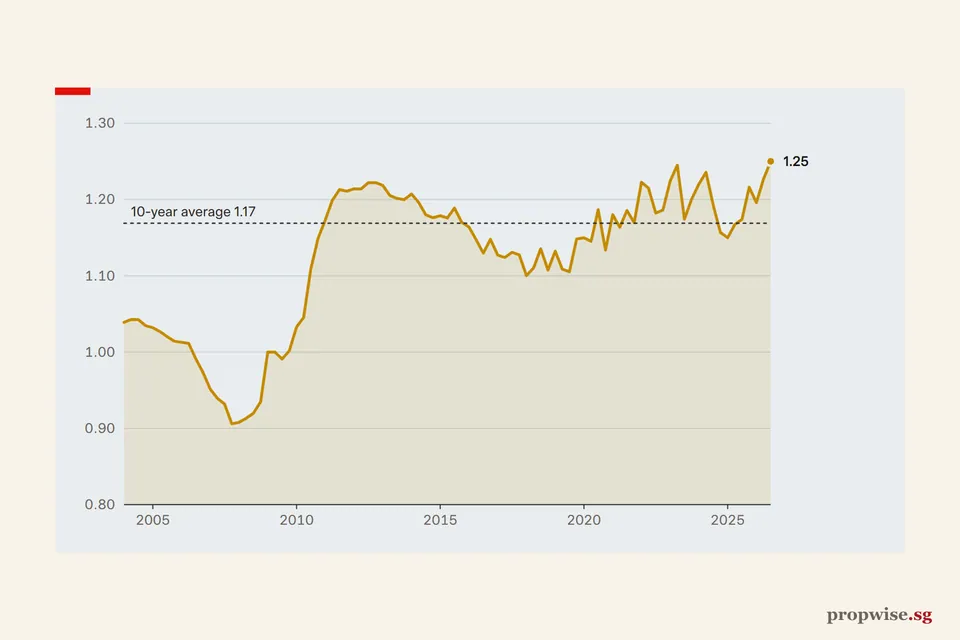
Divide the landed index by the non-landed index and the split is easy to see. A ratio above 1 means landed has risen more since 2009.
Latest: Ratio 1.25 (Q3 2026), up 6.5% on Q3 2025. 10-year average 1.17 (Q4 2016 to Q3 2026).
Table view
| Period | Landed index / non-landed index |
|---|---|
| Q3 2026 | 1.25 |
| Q2 2026 | 1.23 |
| Q1 2026 | 1.20 |
| Q4 2025 | 1.22 |
| Q3 2025 | 1.17 |
| Q2 2025 | 1.17 |
| Q1 2025 | 1.15 |
| Q4 2024 | 1.16 |
| Q3 2024 | 1.19 |
| Q2 2024 | 1.24 |
| Q1 2024 | 1.22 |
| Q4 2023 | 1.20 |
| Q3 2023 | 1.17 |
| Q2 2023 | 1.25 |
| Q1 2023 | 1.22 |
| Q4 2022 | 1.19 |
| Q3 2022 | 1.18 |
| Q2 2022 | 1.22 |
| Q1 2022 | 1.22 |
| Q4 2021 | 1.17 |
| Q3 2021 | 1.19 |
| Q2 2021 | 1.16 |
| Q1 2021 | 1.18 |
| Q4 2020 | 1.13 |
| Q3 2020 | 1.19 |
| Q2 2020 | 1.15 |
| Q1 2020 | 1.15 |
| Q4 2019 | 1.15 |
| Q3 2019 | 1.11 |
| Q2 2019 | 1.11 |
| Q1 2019 | 1.13 |
| Q4 2018 | 1.11 |
| Q3 2018 | 1.14 |
| Q2 2018 | 1.11 |
| Q1 2018 | 1.10 |
| Q4 2017 | 1.13 |
| Q3 2017 | 1.13 |
| Q2 2017 | 1.12 |
| Q1 2017 | 1.13 |
| Q4 2016 | 1.15 |
| Q3 2016 | 1.13 |
| Q2 2016 | 1.15 |
| Q1 2016 | 1.16 |
| Q4 2015 | 1.17 |
| Q3 2015 | 1.19 |
| Q2 2015 | 1.18 |
| Q1 2015 | 1.18 |
| Q4 2014 | 1.18 |
| Q3 2014 | 1.18 |
| Q2 2014 | 1.20 |
| Q1 2014 | 1.21 |
| Q4 2013 | 1.20 |
| Q3 2013 | 1.20 |
| Q2 2013 | 1.21 |
| Q1 2013 | 1.22 |
| Q4 2012 | 1.22 |
| Q3 2012 | 1.22 |
| Q2 2012 | 1.21 |
| Q1 2012 | 1.21 |
| Q4 2011 | 1.21 |
| Q3 2011 | 1.21 |
| Q2 2011 | 1.20 |
| Q1 2011 | 1.17 |
| Q4 2010 | 1.15 |
| Q3 2010 | 1.11 |
| Q2 2010 | 1.05 |
| Q1 2010 | 1.03 |
| Q4 2009 | 1.00 |
| Q3 2009 | 0.99 |
| Q2 2009 | 1.00 |
| Q1 2009 | 1.00 |
| Q4 2008 | 0.93 |
| Q3 2008 | 0.92 |
| Q2 2008 | 0.91 |
| Q1 2008 | 0.91 |
| Q4 2007 | 0.91 |
| Q3 2007 | 0.93 |
| Q2 2007 | 0.94 |
| Q1 2007 | 0.95 |
| Q4 2006 | 0.97 |
| Q3 2006 | 0.99 |
| Q2 2006 | 1.01 |
| Q1 2006 | 1.01 |
| Q4 2005 | 1.01 |
| Q3 2005 | 1.02 |
| Q2 2005 | 1.03 |
| Q1 2005 | 1.03 |
| Q4 2004 | 1.03 |
| Q3 2004 | 1.04 |
| Q2 2004 | 1.04 |
| Q1 2004 | 1.04 |
Source: URA. Data to Q3 2026.
- 2004 to 2007: condos led. The non-landed index rose 56.3% from Q1 2004 to Q4 2007, the landed index 36.3%. The ratio fell to 0.91 in Q4 2007.
- 2007 to 2009: both fell, condos more. From Q4 2007 to Q1 2009 the landed index fell 11.3% and the non-landed index 19.6%.
- 2009 to 2011: landed took off. From Q1 2009 to Q4 2011 the landed index rose 71.0% and the non-landed index 41.2%. The ratio reached 1.21.
Since Q4 2010 the ratio has stayed above 1.1 in all 64 quarters to Q3 2026. It reached 1.25 in Q2 2023, and Q3 2026 set a new high since 2009 at 1.25.
The past two years
From Q3 2024 to Q3 2026 the landed index rose 12.9% (235.5 to 265.9) and the non-landed index 7.7% (197.5 to 212.7). The paths differed:
- Q3 2024 to Q4 2024: landed was flat at 235.3 while non-landed rose 3.0% to 203.4.
- Q4 2024 to Q3 2026: landed rose 13.0% and non-landed 4.6%.
- Non-landed (condos and apartments)
- Landed (houses)
Latest: Non-landed 2.0% (Q3 2026); Landed 8.6% (Q3 2026).
Change on the URA price indices: each final quarter against the same quarter a year earlier.
Table view
| Period | Non-landed (condos and apartments) | Landed (houses) |
|---|---|---|
| Q3 2026 | 2.0% | 8.6% |
| Q2 2026 | 1.8% | 7.0% |
| Q1 2026 | 2.6% | 6.7% |
| Q4 2025 | 2.3% | 7.6% |
| Q3 2025 | 5.6% | 3.9% |
| Q2 2025 | 4.8% | -1.0% |
| Q1 2025 | 4.7% | -1.3% |
| Q4 2024 | 4.7% | 0.9% |
| Q3 2024 | 4.1% | 5.7% |
| Q2 2024 | 6.2% | 5.4% |
| Q1 2024 | 5.0% | 4.6% |
| Q4 2023 | 6.6% | 8.0% |
| Q3 2023 | 4.5% | 3.8% |
| Q2 2023 | 6.8% | 9.4% |
| Q1 2023 | 11.3% | 11.4% |
| Q4 2022 | 8.1% | 9.6% |
| Q3 2022 | 13.6% | 13.2% |
| Q2 2022 | 9.5% | 14.3% |
| Q1 2022 | 6.9% | 10.7% |
| Q4 2021 | 9.8% | 13.3% |
| Q3 2021 | 7.5% | 7.4% |
| Q2 2021 | 6.8% | 8.5% |
| Q1 2021 | 6.1% | 8.9% |
| Q4 2020 | 2.5% | 1.2% |
| Q3 2020 | -0.8% | 6.5% |
| Q2 2020 | 0.4% | 3.7% |
| Q1 2020 | 2.0% | 3.6% |
| Q4 2019 | 1.9% | 5.7% |
| Q3 2019 | 2.7% | -0.1% |
| Q2 2019 | 1.4% | 1.2% |
| Q1 2019 | 2.5% | 5.5% |
Source: URA. Data to Q3 2026.
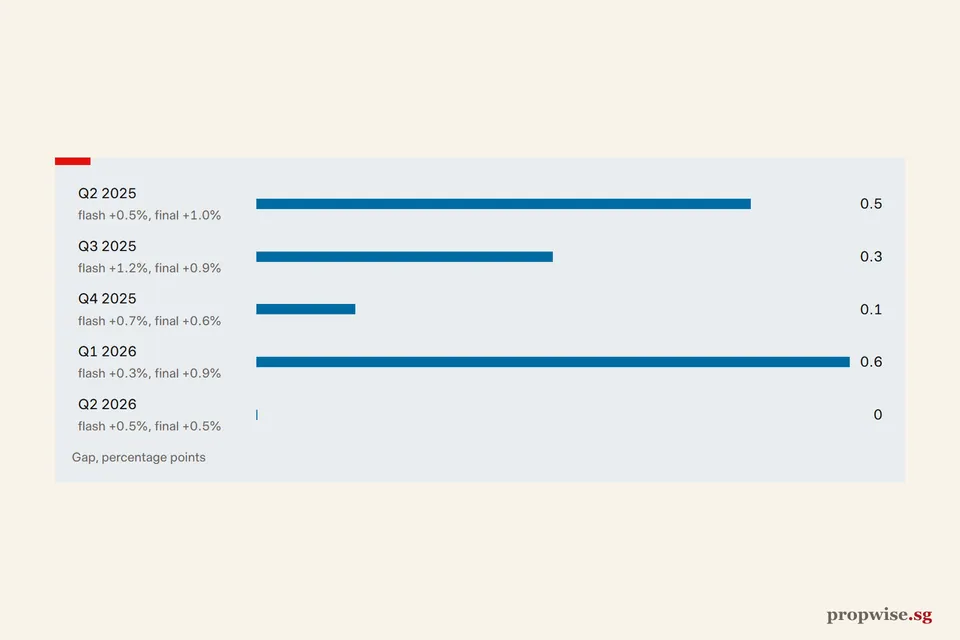
According to URA’s final figures for Q3 2026 (23 October 2026), landed prices rose 2.9% on the quarter and non-landed prices rose 1.0%.
For how the index is built and why flash estimates change, see our guide to the URA price index. To compare private and public housing, see which has performed better.
4 reasons the gap widened
1. Landed supply is scarce. PropNex’s Wong Siew Ying told Stacked Homes in June 2026 that limited supply leaves landed sellers little pressure to cut prices. ERA’s Egan Mah calls the supply finite and a support for long-run prices (13 May 2026).
2. Condo supply is plentiful. URA says the Government is keeping private housing supply high. The 2026 Confirmed List has 9,320 units, more than 50% above the 10-year annual average.
About 60,600 private units (including ECs) are due to complete in the next few years.
- Non-landed (condos and apartments)
- Landed
Latest: Non-landed 48,230 (Q3 2026), up 3.1% on Q3 2025; Landed 1,167 (Q3 2026), down 12.6% on Q3 2025. 10-year average 51,289 (Q4 2016 to Q3 2026).
This is a wider count than URA's headline figure of homes with planning approval (42,472 at Q2 2026, which includes ECs): it also counts projects with provisional permission and sites that are only planned.
Table view
| Period | Non-landed (condos and apartments) | Landed |
|---|---|---|
| Q3 2026 | 48,230 | 1,167 |
| Q2 2026 | 51,677 | 1,109 |
| Q1 2026 | 48,111 | 1,332 |
| Q4 2025 | 47,358 | 1,322 |
| Q3 2025 | 46,787 | 1,336 |
| Q2 2025 | 48,474 | 1,316 |
| Q1 2025 | 44,134 | 1,335 |
| Q4 2024 | 45,934 | 1,337 |
| Q3 2024 | 44,997 | 1,368 |
| Q2 2024 | 49,598 | 1,370 |
| Q1 2024 | 46,335 | 1,369 |
| Q4 2023 | 47,191 | 1,370 |
| Q3 2023 | 46,146 | 980 |
| Q2 2023 | 53,472 | 823 |
| Q1 2023 | 51,703 | 887 |
| Q4 2022 | 53,846 | 946 |
| Q3 2022 | 54,171 | 934 |
| Q2 2022 | 53,879 | 962 |
| Q1 2022 | 52,802 | 970 |
| Q4 2021 | 52,602 | 953 |
| Q3 2021 | 51,176 | 925 |
| Q2 2021 | 51,386 | 1,004 |
| Q1 2021 | 49,910 | 996 |
| Q4 2020 | 51,449 | 954 |
| Q3 2020 | 51,514 | 940 |
| Q2 2020 | 52,116 | 939 |
| Q1 2020 | 51,222 | 863 |
| Q4 2019 | 52,514 | 899 |
| Q3 2019 | 53,757 | 788 |
| Q2 2019 | 54,737 | 864 |
| Q1 2019 | 56,130 | 998 |
| Q4 2018 | 56,602 | 1,000 |
| Q3 2018 | 57,156 | 1,034 |
| Q2 2018 | 54,402 | 921 |
| Q1 2018 | 50,907 | 1,180 |
| Q4 2017 | 49,618 | 1,234 |
| Q3 2017 | 41,858 | 1,196 |
| Q2 2017 | 43,465 | 1,199 |
| Q1 2017 | 43,457 | 1,255 |
| Q4 2016 | 47,016 | 1,352 |
| Q3 2016 | 47,702 | 1,383 |
| Q2 2016 | 50,339 | 1,507 |
| Q1 2016 | 56,015 | 1,582 |
| Q4 2015 | 57,867 | 2,292 |
| Q3 2015 | 61,715 | 2,462 |
| Q2 2015 | 64,437 | 2,774 |
| Q1 2015 | 69,520 | 2,823 |
| Q4 2014 | 72,279 | 2,909 |
| Q3 2014 | 76,383 | 2,981 |
| Q2 2014 | 80,476 | 3,157 |
| Q1 2014 | 83,044 | 3,355 |
| Q4 2013 | 86,541 | 3,477 |
| Q3 2013 | 86,981 | 3,744 |
| Q2 2013 | 90,948 | 3,825 |
| Q1 2013 | 91,408 | 3,804 |
| Q4 2012 | 92,370 | 3,860 |
| Q3 2012 | 88,084 | 3,785 |
| Q2 2012 | 89,087 | 3,784 |
| Q1 2012 | 85,954 | 3,885 |
| Q4 2011 | 85,724 | 3,807 |
| Q3 2011 | 82,460 | 3,872 |
| Q2 2011 | 83,241 | 4,001 |
| Q1 2011 | 76,128 | 4,044 |
| Q4 2010 | 75,514 | 3,963 |
| Q3 2010 | 69,054 | 3,933 |
| Q2 2010 | 68,544 | 3,914 |
| Q1 2010 | 63,729 | 3,942 |
| Q4 2009 | 62,240 | 4,186 |
| Q3 2009 | 57,880 | 4,209 |
| Q2 2009 | 58,189 | 4,423 |
| Q1 2009 | 59,880 | 4,614 |
| Q4 2008 | 61,357 | 4,872 |
| Q3 2008 | 62,481 | 4,982 |
| Q2 2008 | 66,516 | 5,127 |
| Q1 2008 | 68,960 | 5,248 |
| Q4 2007 | 69,066 | 5,056 |
| Q3 2007 | 65,868 | 4,853 |
| Q2 2007 | 61,159 | 4,453 |
| Q1 2007 | 53,556 | 4,352 |
| Q4 2006 | 49,053 | 4,452 |
| Q3 2006 | 49,402 | 4,357 |
| Q2 2006 | 47,753 | 4,498 |
| Q1 2006 | 44,665 | 4,397 |
| Q4 2005 | 43,448 | 4,458 |
| Q3 2005 | 42,121 | 4,737 |
| Q2 2005 | 41,227 | 4,684 |
| Q1 2005 | 42,349 | 4,350 |
Source: URA. Data to Q3 2026.
3. Wealthy owner-occupiers set the pace for landed. PropNex counted 869 landed deals in H1 2026, down from 1,009 in H1 2025.
Yet 32.9% of non-GCB landed sales exceeded S$15 million, up from 25.5% in H2 2025 (as reported by Stacked Homes). ERA found 57.9% of Q1 2026 landed deals above S$5 million.
With fewer deals at higher prices, a few big sales can move the line.
4. Condo buyers are holding back. In Q2 2026 PropNex linked part of the non-landed dip to the mix of transactions. In Q3, Huttons’ Mark Yip said sales were supply-led and the lowest for a third quarter since 1998, as buyers delayed after recent rule changes.
Where landed prices go next
Analysts differ on 2026. ERA expects landed prices to rise 5% to 7% and PropNex 2% to 4%.
Landed prices were already 8.6% higher in Q3 2026 than a year earlier. That is above both ranges.
| Forecast for landed prices in 2026 | Range | Landed index, Q3 2026, on a year earlier |
|---|---|---|
| ERA | +5% to +7% | Above the range |
| PropNex | +2% to +4% | Above the range |