Private Home Rent Index: Where Rents Stand and What Moves Them
The URA private home rent index hit a record high in Q3 2026. What the number means, how it moved, and why supply and vacancy matter.
The URA private home rent index stood at 164.6 in Q3 2026, +1.8% on a year earlier. That is a record high, just above the 164.5 of Q3 2023.
The base is Q1 2009, set at 100. So an index of 164.6 says rents, on the whole, are well above their 2009 level.
What the number measures
URA builds the private residential rental index from rental contracts, and adjusts for differences between the homes let. It covers condos, apartments and landed homes. Think of it as a measuring tape: you read it as a change between two dates.
Two dates tell the story. From Q4 2020 to Q3 2023, the index went from 103.9 to 164.5.
That is a rise of about 58% in under three years. It then slipped to 156.6 in Q2 2024 and has climbed back since.
- Prices (URA price index)
- Rents (URA rental index)
Latest: Prices 222.5 (Q3 2026), up 3.4% on Q3 2025; Rents 164.6 (Q3 2026), up 1.8% on Q3 2025.
Table view
| Period | Prices (URA price index) | Rents (URA rental index) |
|---|---|---|
| Q3 2026 | 222.5 | 164.6 |
| Q2 2026 | 219.4 | 162.5 |
| Q1 2026 | 218.3 | 161.4 |
| Q4 2025 | 216.4 | 160.9 |
| Q3 2025 | 215.1 | 161.7 |
| Q2 2025 | 213.2 | 159.8 |
| Q1 2025 | 211.1 | 158.5 |
| Q4 2024 | 209.4 | 157.9 |
| Q3 2024 | 204.7 | 157.9 |
| Q2 2024 | 206.1 | 156.6 |
| Q1 2024 | 204.3 | 157.9 |
| Q4 2023 | 201.5 | 161.0 |
| Q3 2023 | 196.0 | 164.5 |
| Q2 2023 | 194.4 | 163.2 |
| Q1 2023 | 194.8 | 158.8 |
| Q4 2022 | 188.6 | 148.1 |
| Q3 2022 | 187.8 | 137.9 |
| Q2 2022 | 180.9 | 127.0 |
| Q1 2022 | 174.8 | 119.0 |
| Q4 2021 | 173.6 | 114.2 |
| Q3 2021 | 165.3 | 111.3 |
| Q2 2021 | 163.5 | 109.3 |
| Q1 2021 | 162.2 | 106.2 |
| Q4 2020 | 157.0 | 103.9 |
| Q3 2020 | 153.8 | 103.8 |
| Q2 2020 | 152.6 | 104.3 |
| Q1 2020 | 152.1 | 105.6 |
| Q4 2019 | 153.6 | 104.5 |
| Q3 2019 | 152.8 | 105.6 |
| Q2 2019 | 150.8 | 105.5 |
| Q1 2019 | 148.6 | 104.1 |
| Q4 2018 | 149.6 | 103.1 |
| Q3 2018 | 149.7 | 104.1 |
| Q2 2018 | 149.0 | 103.8 |
| Q1 2018 | 144.1 | 102.8 |
| Q4 2017 | 138.7 | 102.5 |
| Q3 2017 | 137.6 | 103.4 |
| Q2 2017 | 136.6 | 103.4 |
| Q1 2017 | 136.7 | 103.6 |
| Q4 2016 | 137.2 | 104.5 |
| Q3 2016 | 137.9 | 105.6 |
| Q2 2016 | 140.0 | 106.9 |
| Q1 2016 | 140.6 | 107.5 |
| Q4 2015 | 141.6 | 108.9 |
| Q3 2015 | 142.3 | 110.3 |
| Q2 2015 | 144.2 | 111.0 |
| Q1 2015 | 145.5 | 112.2 |
| Q4 2014 | 147.0 | 114.1 |
| Q3 2014 | 148.6 | 115.2 |
| Q2 2014 | 149.7 | 116.1 |
| Q1 2014 | 151.3 | 116.8 |
| Q4 2013 | 153.2 | 117.6 |
| Q3 2013 | 154.6 | 118.2 |
| Q2 2013 | 154.0 | 117.9 |
| Q1 2013 | 152.4 | 117.6 |
| Q4 2012 | 151.5 | 116.6 |
| Q3 2012 | 148.8 | 115.9 |
| Q2 2012 | 147.9 | 114.8 |
| Q1 2012 | 147.2 | 114.5 |
| Q4 2011 | 147.4 | 114.2 |
| Q3 2011 | 147.0 | 113.7 |
| Q2 2011 | 145.1 | 112.8 |
| Q1 2011 | 142.3 | 111.4 |
| Q4 2010 | 139.2 | 110.0 |
| Q3 2010 | 135.5 | 107.2 |
| Q2 2010 | 131.7 | 103.5 |
| Q1 2010 | 125.1 | 97.7 |
| Q4 2009 | 118.4 | 93.3 |
| Q3 2009 | 110.3 | 92.8 |
| Q2 2009 | 95.3 | 94.8 |
| Q1 2009 | 100.0 | 100.0 |
| Q4 2008 | 116.4 | 109.3 |
| Q3 2008 | 123.9 | 115.5 |
| Q2 2008 | 126.9 | 116.5 |
| Q1 2008 | 126.7 | 113.6 |
| Q4 2007 | 122.1 | 107.2 |
| Q3 2007 | 114.4 | 100.4 |
| Q2 2007 | 105.6 | 90.1 |
| Q1 2007 | 97.6 | 81.6 |
| Q4 2006 | 93.1 | 75.9 |
| Q3 2006 | 89.6 | 72.1 |
| Q2 2006 | 87.3 | 68.7 |
| Q1 2006 | 85.8 | 67.2 |
| Q4 2005 | 84.5 | 66.5 |
| Q3 2005 | 83.3 | 66.1 |
| Q2 2005 | 82.3 | 65.6 |
| Q1 2005 | 81.9 | 65.2 |
| Q4 2004 | 81.3 | 64.6 |
| Q3 2004 | 80.7 | 64.2 |
| Q2 2004 | 80.4 | 64.0 |
| Q1 2004 | 80.3 | 64.0 |
Source: URA. Data to Q3 2026.
The last eight quarters
The index crept up through 2025, dipped once, then picked up again. These are final figures from Q4 2024 to Q3 2026, with changes worked out from the index (URA, via SingStat):
| Quarter | Index | Change, quarter-on-quarter |
|---|---|---|
| Q4 2024 | 157.9 | 0.0% |
| Q1 2025 | 158.5 | +0.4% |
| Q2 2025 | 159.8 | +0.8% |
| Q3 2025 | 161.7 | +1.2% |
| Q4 2025 | 160.9 | -0.5% |
| Q1 2026 | 161.4 | +0.3% |
| Q2 2026 | 162.5 | +0.7% |
| Q3 2026 | 164.6 | +1.3% |
Over those two years the index rose about 4.2%, from 157.9 in Q3 2024. That is slow progress, closer to a stroll than a sprint.
The newest reading is final data for Q3 2026. The index rose 1.3% quarter-on-quarter.
What is behind the numbers
1. Landed homes swing harder than condos.
In Q3 2026, URA’s landed rent index rose 2.1% quarter-on-quarter while the non-landed index rose 1.2% (URA, 23 October 2026). The landed line is jumpier: from Q1 2025 to Q3 2026 it moved between 152.0 and 159.7 (URA, via SingStat).
2. The three regions pull in different directions.
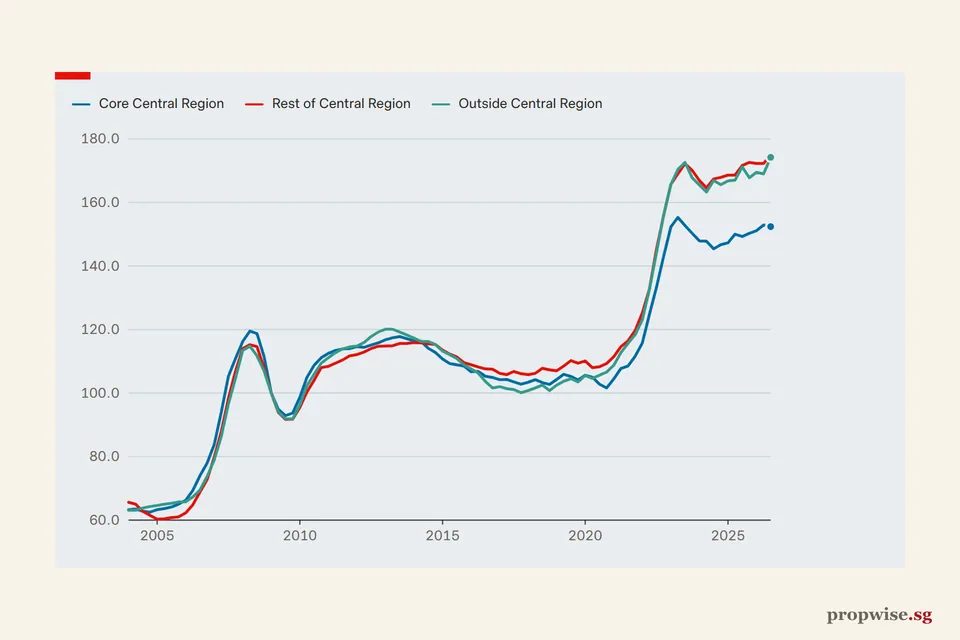
In Q3 2026, non-landed rents rose 3.1% quarter-on-quarter in the Outside Central Region (OCR) and 1.5% in the Rest of Central Region (RCR).
They fell 0.3% in the Core Central Region (CCR), per the URA release. The RCR index (174.9) and the OCR index (174.2) both reached new highs, while the CCR index (152.4) stayed below its 155.3 peak of Q2 2023. One average hides three small stories.
- Core Central Region
- Rest of Central Region
- Outside Central Region
Latest: CCR 152.4 (Q3 2026), up 2.1% on Q3 2025; RCR 174.9 (Q3 2026), up 1.9% on Q3 2025; OCR 174.2 (Q3 2026), up 1.8% on Q3 2025.
Table view
| Period | Core Central Region | Rest of Central Region | Outside Central Region |
|---|---|---|---|
| Q3 2026 | 152.4 | 174.9 | 174.2 |
| Q2 2026 | 152.9 | 172.3 | 169.0 |
| Q1 2026 | 151.1 | 172.3 | 169.5 |
| Q4 2025 | 150.3 | 172.6 | 167.8 |
| Q3 2025 | 149.3 | 171.6 | 171.2 |
| Q2 2025 | 150.0 | 168.6 | 167.0 |
| Q1 2025 | 147.3 | 168.6 | 166.8 |
| Q4 2024 | 146.7 | 167.9 | 165.6 |
| Q3 2024 | 145.4 | 167.4 | 166.9 |
| Q2 2024 | 147.8 | 164.6 | 163.3 |
| Q1 2024 | 147.9 | 166.9 | 165.5 |
| Q4 2023 | 150.3 | 170.1 | 167.8 |
| Q3 2023 | 152.7 | 172.2 | 172.6 |
| Q2 2023 | 155.3 | 169.0 | 170.4 |
| Q1 2023 | 152.3 | 165.7 | 165.6 |
| Q4 2022 | 143.1 | 156.0 | 156.1 |
| Q3 2022 | 133.4 | 145.4 | 144.3 |
| Q2 2022 | 124.7 | 132.7 | 132.6 |
| Q1 2022 | 115.8 | 125.3 | 123.1 |
| Q4 2021 | 111.6 | 119.7 | 118.4 |
| Q3 2021 | 108.5 | 116.4 | 115.6 |
| Q2 2021 | 107.7 | 114.6 | 112.7 |
| Q1 2021 | 104.5 | 111.5 | 108.8 |
| Q4 2020 | 101.6 | 109.3 | 106.6 |
| Q3 2020 | 102.8 | 108.3 | 105.6 |
| Q2 2020 | 105.0 | 108.0 | 104.6 |
| Q1 2020 | 105.6 | 110.1 | 105.5 |
| Q4 2019 | 104.1 | 109.4 | 103.5 |
| Q3 2019 | 105.2 | 110.2 | 104.5 |
| Q2 2019 | 105.9 | 108.5 | 103.7 |
| Q1 2019 | 104.3 | 107.0 | 102.5 |
| Q4 2018 | 102.7 | 107.3 | 100.8 |
| Q3 2018 | 103.3 | 107.8 | 102.5 |
| Q2 2018 | 104.2 | 106.2 | 101.6 |
| Q1 2018 | 103.4 | 105.8 | 100.8 |
| Q4 2017 | 102.8 | 106.1 | 100.1 |
| Q3 2017 | 103.5 | 106.8 | 101.1 |
| Q2 2017 | 104.3 | 105.8 | 101.4 |
| Q1 2017 | 104.2 | 106.2 | 102.0 |
| Q4 2016 | 104.9 | 107.5 | 101.6 |
| Q3 2016 | 105.3 | 107.6 | 103.7 |
| Q2 2016 | 106.8 | 108.2 | 106.3 |
| Q1 2016 | 106.7 | 108.9 | 107.6 |
| Q4 2015 | 108.5 | 109.6 | 108.9 |
| Q3 2015 | 108.9 | 111.4 | 110.9 |
| Q2 2015 | 109.3 | 112.3 | 112.1 |
| Q1 2015 | 110.7 | 113.5 | 113.2 |
| Q4 2014 | 112.8 | 115.3 | 115.3 |
| Q3 2014 | 114.1 | 115.5 | 116.2 |
| Q2 2014 | 116.3 | 115.8 | 116.2 |
| Q1 2014 | 116.4 | 115.9 | 117.3 |
| Q4 2013 | 117.1 | 115.6 | 118.3 |
| Q3 2013 | 117.8 | 115.6 | 119.2 |
| Q2 2013 | 117.4 | 114.9 | 120.1 |
| Q1 2013 | 116.8 | 114.8 | 120.1 |
| Q4 2012 | 115.8 | 114.7 | 119.2 |
| Q3 2012 | 115.1 | 114.0 | 117.8 |
| Q2 2012 | 114.4 | 112.9 | 115.9 |
| Q1 2012 | 114.6 | 112.1 | 114.8 |
| Q4 2011 | 114.0 | 111.7 | 114.5 |
| Q3 2011 | 113.9 | 110.4 | 113.9 |
| Q2 2011 | 113.4 | 109.4 | 112.7 |
| Q1 2011 | 112.5 | 108.4 | 111.1 |
| Q4 2010 | 111.1 | 108.0 | 109.4 |
| Q3 2010 | 108.7 | 104.0 | 105.9 |
| Q2 2010 | 104.9 | 100.3 | 102.3 |
| Q1 2010 | 98.7 | 95.5 | 96.3 |
| Q4 2009 | 93.7 | 91.8 | 91.9 |
| Q3 2009 | 92.9 | 91.7 | 91.9 |
| Q2 2009 | 94.9 | 93.9 | 94.1 |
| Q1 2009 | 100.0 | 100.0 | 100.0 |
| Q4 2008 | 111.4 | 107.8 | 106.9 |
| Q3 2008 | 118.7 | 114.6 | 111.7 |
| Q2 2008 | 119.5 | 115.2 | 114.8 |
| Q1 2008 | 116.2 | 114.0 | 113.4 |
| Q4 2007 | 110.9 | 106.9 | 104.7 |
| Q3 2007 | 105.3 | 98.3 | 96.5 |
| Q2 2007 | 93.9 | 87.8 | 86.3 |
| Q1 2007 | 83.8 | 79.8 | 78.9 |
| Q4 2006 | 77.9 | 72.7 | 73.7 |
| Q3 2006 | 73.9 | 68.7 | 69.4 |
| Q2 2006 | 69.3 | 64.8 | 67.3 |
| Q1 2006 | 66.3 | 62.3 | 65.8 |
| Q4 2005 | 65.0 | 61.0 | 65.7 |
| Q3 2005 | 64.1 | 60.8 | 65.3 |
| Q2 2005 | 63.6 | 60.4 | 65.0 |
| Q1 2005 | 63.3 | 60.3 | 64.6 |
| Q4 2004 | 62.5 | 61.5 | 64.3 |
| Q3 2004 | 62.8 | 62.8 | 63.8 |
| Q2 2004 | 63.5 | 65.0 | 63.1 |
| Q1 2004 | 63.3 | 65.6 | 63.1 |
Source: URA. Data to Q3 2026.
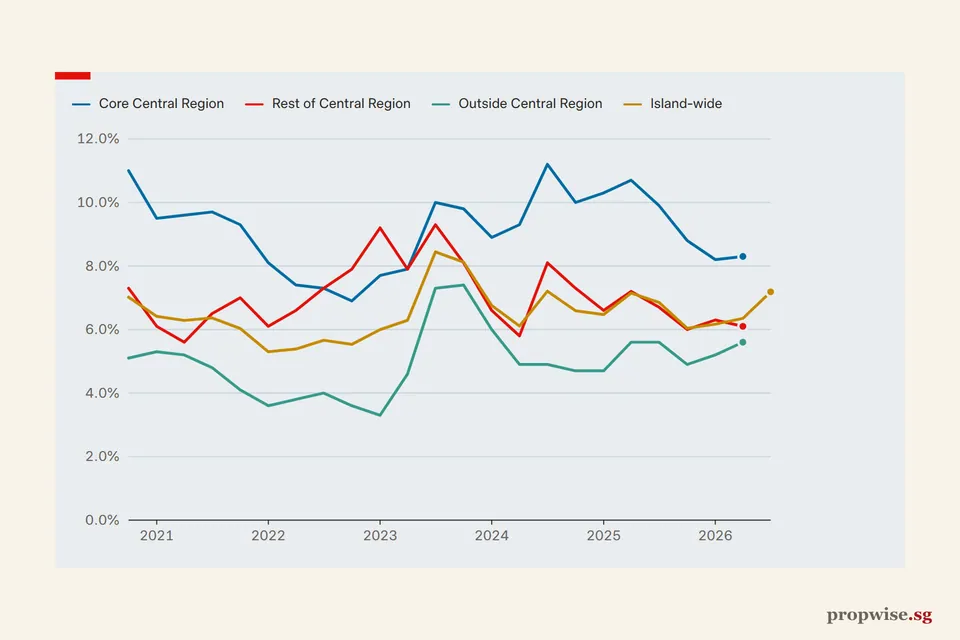
3. Vacancy is the supply signal. Vacancy was 7.2% in Q3 2026, up from 6.4% in Q2 2026 after a jump in completions, per the URA release.
By region, the CCR was highest at 8.4%, then the RCR at 7.4% and the OCR at 6.5%. More empty homes give tenants more choice.
Latest: Vacancy 7.2% (Q3 2026), up 0.3 percentage points on Q3 2025.
Vacancy is calculated as vacant units divided by units available, using URA counts of completed private homes (landed and non-landed).
Table view
| Period | Private homes vacant (%) |
|---|---|
| Q3 2026 | 7.2% |
| Q2 2026 | 6.4% |
| Q1 2026 | 6.2% |
| Q4 2025 | 6.0% |
| Q3 2025 | 6.9% |
| Q2 2025 | 7.1% |
| Q1 2025 | 6.5% |
| Q4 2024 | 6.6% |
| Q3 2024 | 7.2% |
| Q2 2024 | 6.1% |
| Q1 2024 | 6.8% |
| Q4 2023 | 8.1% |
| Q3 2023 | 8.4% |
| Q2 2023 | 6.3% |
| Q1 2023 | 6.0% |
| Q4 2022 | 5.5% |
| Q3 2022 | 5.7% |
| Q2 2022 | 5.4% |
| Q1 2022 | 5.3% |
| Q4 2021 | 6.0% |
| Q3 2021 | 6.4% |
| Q2 2021 | 6.3% |
| Q1 2021 | 6.4% |
| Q4 2020 | 7.0% |
| Q3 2020 | 6.2% |
| Q2 2020 | 5.4% |
| Q1 2020 | 5.4% |
| Q4 2019 | 5.5% |
| Q3 2019 | 6.1% |
| Q2 2019 | 6.4% |
| Q1 2019 | 6.3% |
| Q4 2018 | 6.4% |
| Q3 2018 | 6.8% |
| Q2 2018 | 7.1% |
| Q1 2018 | 7.4% |
| Q4 2017 | 7.8% |
| Q3 2017 | 8.4% |
| Q2 2017 | 8.1% |
| Q1 2017 | 8.1% |
| Q4 2016 | 8.4% |
| Q3 2016 | 8.7% |
| Q2 2016 | 8.9% |
| Q1 2016 | 7.5% |
| Q4 2015 | 8.1% |
| Q3 2015 | 7.8% |
| Q2 2015 | 7.9% |
| Q1 2015 | 7.2% |
| Q4 2014 | 7.8% |
| Q3 2014 | 7.1% |
| Q2 2014 | 7.1% |
| Q1 2014 | 6.6% |
| Q4 2013 | 6.2% |
| Q3 2013 | 6.1% |
| Q2 2013 | 5.6% |
| Q1 2013 | 5.2% |
| Q4 2012 | 5.4% |
| Q3 2012 | 6.1% |
| Q2 2012 | 5.9% |
| Q1 2012 | 6.0% |
| Q4 2011 | 5.9% |
| Q3 2011 | 5.8% |
| Q2 2011 | 5.1% |
| Q1 2011 | 4.9% |
| Q4 2010 | 5.0% |
| Q3 2010 | 5.2% |
| Q2 2010 | 5.4% |
| Q1 2010 | 4.6% |
| Q4 2009 | 5.0% |
| Q3 2009 | 6.2% |
| Q2 2009 | 5.9% |
| Q1 2009 | 5.9% |
| Q4 2008 | 6.1% |
| Q3 2008 | 5.8% |
| Q2 2008 | 6.1% |
| Q1 2008 | 6.3% |
| Q4 2007 | 5.6% |
| Q3 2007 | 5.4% |
| Q2 2007 | 4.9% |
| Q1 2007 | 5.1% |
| Q4 2006 | 6.1% |
| Q3 2006 | 6.6% |
| Q2 2006 | 6.5% |
| Q1 2006 | 7.4% |
| Q4 2005 | 8.4% |
| Q3 2005 | 8.5% |
| Q2 2005 | 8.7% |
| Q1 2005 | 8.8% |
| Q4 2004 | 8.1% |
| Q3 2004 | 8.5% |
| Q2 2004 | 8.3% |
| Q1 2004 | 8.4% |
| Q4 2003 | 7.7% |
| Q3 2003 | 8.1% |
| Q2 2003 | 7.6% |
| Q1 2003 | 7.6% |
| Q4 2002 | 8.5% |
| Q3 2002 | 8.1% |
| Q2 2002 | 8.3% |
| Q1 2002 | 7.6% |
| Q4 2001 | 8.2% |
| Q3 2001 | 7.6% |
| Q2 2001 | 7.1% |
| Q1 2001 | 6.5% |
| Q4 2000 | 6.9% |
| Q3 2000 | 7.9% |
| Q2 2000 | 9.1% |
| Q1 2000 | 8.5% |
Source: URA. Data to Q3 2026.
4. More homes are coming. URA recorded 3,559 private homes, including ECs, completed in Q3 2026, up from 1,212 in Q2 (URA).
That is the most in a quarter since Q3 2024. Suburban landlords now have more rivals for the same tenant, yet OCR rents still rose fastest.
How to use the number
Use the index as a backdrop, then price your own unit from comparable lettings. The index says where the market sits. Your lease depends on your block, your floor and your landlord.
Our guides cover the next steps: how to rent a home in Singapore, how to work out rental yield and the regional view in condo rents by region.