Condo Rents: Are They Still Rising? CCR, RCR, OCR Compared
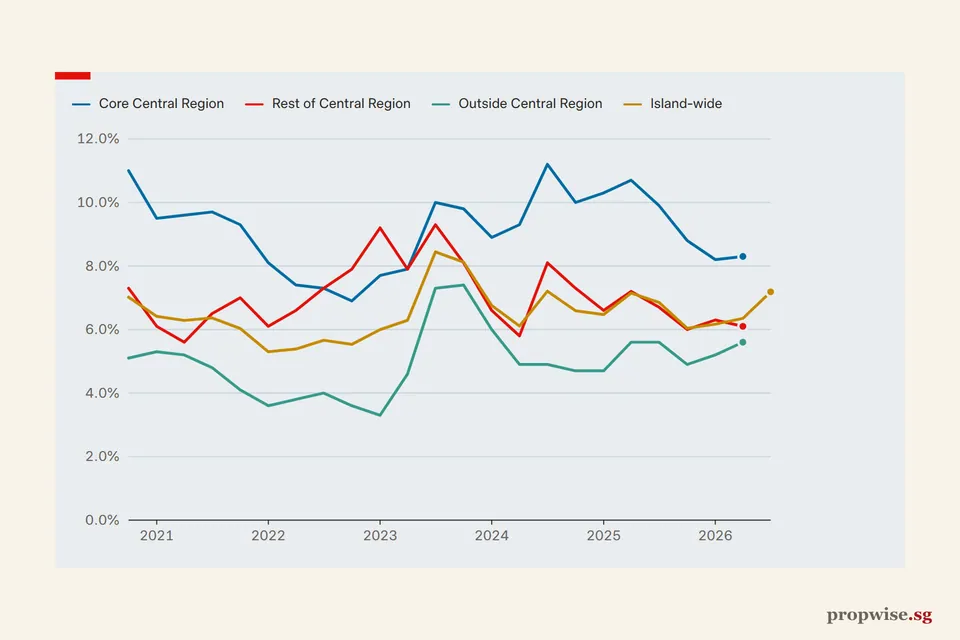
Condo rent growth by region on a year earlier, from the 2023 peak to today. What the URA rental index shows for the CCR, RCR and OCR.
Condo rents are still rising, but slowly. In Q3 2026 the URA rental index was +2.1% on a year earlier in the Core Central Region (CCR), +1.9% in the Rest of Central Region (RCR) and +1.8% in the Outside Central Region (OCR).
- Core Central Region
- Rest of Central Region
- Outside Central Region
Latest: CCR 2.1% (Q3 2026); RCR 1.9% (Q3 2026); OCR 1.8% (Q3 2026).
Change on the URA rental index: each quarter against the same quarter a year earlier.
Table view
| Period | Core Central Region | Rest of Central Region | Outside Central Region |
|---|---|---|---|
| Q3 2026 | 2.1% | 1.9% | 1.8% |
| Q2 2026 | 1.9% | 2.2% | 1.2% |
| Q1 2026 | 2.6% | 2.2% | 1.6% |
| Q4 2025 | 2.5% | 2.8% | 1.3% |
| Q3 2025 | 2.7% | 2.5% | 2.6% |
| Q2 2025 | 1.5% | 2.4% | 2.3% |
| Q1 2025 | -0.4% | 1.0% | 0.8% |
| Q4 2024 | -2.4% | -1.3% | -1.3% |
| Q3 2024 | -4.8% | -2.8% | -3.3% |
| Q2 2024 | -4.8% | -2.6% | -4.2% |
| Q1 2024 | -2.9% | 0.7% | -0.1% |
| Q4 2023 | 5.0% | 9.0% | 7.5% |
| Q3 2023 | 14.5% | 18.4% | 19.6% |
| Q2 2023 | 24.5% | 27.4% | 28.5% |
| Q1 2023 | 31.5% | 32.2% | 34.5% |
| Q4 2022 | 28.2% | 30.3% | 31.8% |
| Q3 2022 | 22.9% | 24.9% | 24.8% |
| Q2 2022 | 15.8% | 15.8% | 17.7% |
| Q1 2022 | 10.8% | 12.4% | 13.1% |
| Q4 2021 | 9.8% | 9.5% | 11.1% |
| Q3 2021 | 5.5% | 7.5% | 9.5% |
| Q2 2021 | 2.6% | 6.1% | 7.7% |
| Q1 2021 | -1.0% | 1.3% | 3.1% |
| Q4 2020 | -2.4% | -0.1% | 3.0% |
| Q3 2020 | -2.3% | -1.7% | 1.1% |
| Q2 2020 | -0.8% | -0.5% | 0.9% |
| Q1 2020 | 1.2% | 2.9% | 2.9% |
| Q4 2019 | 1.4% | 2.0% | 2.7% |
| Q3 2019 | 1.8% | 2.2% | 2.0% |
| Q2 2019 | 1.6% | 2.2% | 2.1% |
| Q1 2019 | 0.9% | 1.1% | 1.7% |
| Q4 2018 | -0.1% | 1.1% | 0.7% |
| Q3 2018 | -0.2% | 0.9% | 1.4% |
| Q2 2018 | -0.1% | 0.4% | 0.2% |
| Q1 2018 | -0.8% | -0.4% | -1.2% |
| Q4 2017 | -2.0% | -1.3% | -1.5% |
| Q3 2017 | -1.7% | -0.7% | -2.5% |
| Q2 2017 | -2.3% | -2.2% | -4.6% |
| Q1 2017 | -2.3% | -2.5% | -5.2% |
| Q4 2016 | -3.3% | -1.9% | -6.7% |
| Q3 2016 | -3.3% | -3.4% | -6.5% |
| Q2 2016 | -2.3% | -3.7% | -5.2% |
| Q1 2016 | -3.6% | -4.1% | -4.9% |
| Q4 2015 | -3.8% | -4.9% | -5.6% |
| Q3 2015 | -4.6% | -3.5% | -4.6% |
| Q2 2015 | -6.0% | -3.0% | -3.5% |
| Q1 2015 | -4.9% | -2.1% | -3.5% |
Source: URA. Data to Q3 2026.
The chart shows the yearly change in each region’s rent index, not the level. A line above zero means rents are higher than a year earlier.
From a spike to a crawl
Rents jumped in 2022 and 2023. Yearly growth peaked at between 31% and 35% in Q1 2023 in all three regions, then cooled.
All three lines fell below zero from Q2 to Q4 2024. Growth has been positive again since Q2 2025, at about 1% to 3%.
The index in levels
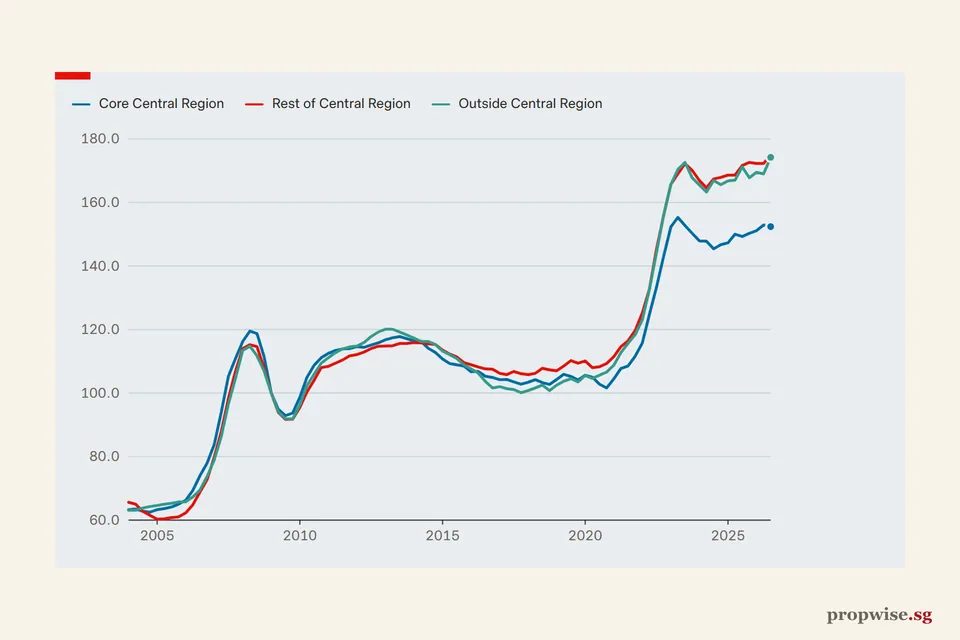
The yearly change hides how far rents sit from their peaks. The table shows the index at its peak and in Q3 2026 (URA, final figures).
| Region | Peak | Q3 2026 |
|---|---|---|
| CCR | 155.3 (Q2 2023) | 152.4 |
| RCR | 174.9 (Q3 2026) | 174.9 |
| OCR | 174.2 (Q3 2026) | 174.2 |
The RCR and OCR indexes set new highs in Q3 2026. The CCR index is about 2% below its Q2 2023 peak.
For the level of the index and rents in dollars per sq ft, see our piece on condo rents by region. To work out what a rent means for an investor, read how to calculate rental yield.
Source: URA. Data to Q3 2026.