4 Upside-Down Property Investing Strategies in Singapore (2026)
Four contrarian ways to build property wealth in Singapore in 2026: focus, low costs, cash first and cash flow, tested against ABSD, SSD and a 4% stress rate.
Most property investors copy the crowd: they buy what is hot, borrow as much as the bank allows and hope prices rise. The “upside down” approach does the opposite. It focuses on one market, keeps costs low, holds cash and judges a property by what it earns. The idea is sound, but the 2026 rules change the numbers, and the common claim that you can easily buy at fire-sale prices in a downturn needs a hard look.
At a glance
- Focus pays. In the Q3 2026 final, prices rose 2.3% in the suburbs (OCR) but rose 0.3% in the core central region (CCR).
- Costs matter more than ever. A citizen’s second home carries 20% ABSD. On a S$1.5m condo you need about S$1.17m in cash and CPF before the keys are yours.
- “Cash is king” has a catch. A 12% price fall on that condo saves S$180,000, but ABSD and the other costs still take S$301,400.
- Cash flow is harder to find. To earn S$1,000 a month after loan payments, a 45% loan needs a net yield of about 2.7% at today’s rates and 3.4% at a 4% rate. The average gross yield is about 3.1%.
Strategy 1: Focus on one area and one segment
Avoid running around like ants on a hot plate. The data shows why. URA’s final for Q3 2026 showed the private price index rose 1.4% overall. Underneath, the core central region rose 0.3%, the city fringe (RCR) was flat 0.0%, the suburbs rose 2.3% and landed homes rose 2.9%. In Q2 2026, vacancy was 8.3% in the core central region, 6.1% in the city fringe and 5.6% in the suburbs. An investor who “buys Singapore property” has bought none of these markets in particular.
- Core Central Region
- Rest of Central Region
- Outside Central Region
- Policy measures (select one for details)
Latest: CCR 162.0 (Q3 2026), down 0.9% on Q3 2025; RCR 226.2 (Q3 2026), up 0.3% on Q3 2025; OCR 277.3 (Q3 2026), up 5.4% on Q3 2025.
Table view
| Period | Core Central Region | Rest of Central Region | Outside Central Region |
|---|---|---|---|
| Q3 2026 | 162.0 | 226.2 | 277.3 |
| Q2 2026 | 161.5 | 226.2 | 271.1 |
| Q1 2026 | 158.6 | 228.9 | 271.4 |
| Q4 2025 | 157.7 | 227.1 | 265.6 |
| Q3 2025 | 163.4 | 225.5 | 263.0 |
| Q2 2025 | 160.7 | 224.8 | 260.9 |
| Q1 2025 | 156.0 | 227.3 | 258.1 |
| Q4 2024 | 154.8 | 223.5 | 257.3 |
| Q3 2024 | 150.9 | 217.0 | 249.1 |
| Q2 2024 | 152.6 | 215.3 | 249.1 |
| Q1 2024 | 153.1 | 211.9 | 248.6 |
| Q4 2023 | 148.1 | 211.3 | 248.1 |
| Q3 2023 | 142.5 | 213.0 | 237.4 |
| Q2 2023 | 146.5 | 208.6 | 225.0 |
| Q1 2023 | 146.6 | 213.9 | 222.3 |
| Q4 2022 | 145.4 | 204.9 | 218.2 |
| Q3 2022 | 144.4 | 198.7 | 224.0 |
| Q2 2022 | 141.2 | 193.3 | 208.4 |
| Q1 2022 | 138.6 | 181.7 | 204.1 |
| Q4 2021 | 138.7 | 186.7 | 199.7 |
| Q3 2021 | 135.1 | 175.0 | 188.9 |
| Q2 2021 | 135.8 | 170.6 | 189.1 |
| Q1 2021 | 134.3 | 170.4 | 185.6 |
| Q4 2020 | 133.6 | 160.6 | 183.6 |
| Q3 2020 | 129.5 | 153.8 | 180.4 |
| Q2 2020 | 134.6 | 150.0 | 177.4 |
| Q1 2020 | 131.1 | 152.6 | 177.2 |
| Q4 2019 | 134.1 | 153.4 | 177.9 |
| Q3 2019 | 138.0 | 155.4 | 173.1 |
| Q2 2019 | 135.3 | 153.4 | 171.7 |
| Q1 2019 | 132.3 | 148.2 | 171.0 |
| Q4 2018 | 136.4 | 149.2 | 170.7 |
| Q3 2018 | 137.8 | 146.6 | 169.5 |
| Q2 2018 | 136.0 | 148.5 | 169.7 |
| Q1 2018 | 134.8 | 140.6 | 164.8 |
| Q4 2017 | 127.8 | 138.9 | 156.1 |
| Q3 2017 | 126.0 | 138.3 | 154.9 |
| Q2 2017 | 125.9 | 137.6 | 153.7 |
| Q1 2017 | 126.5 | 136.8 | 154.2 |
| Q4 2016 | 127.0 | 136.4 | 154.0 |
| Q3 2016 | 126.9 | 139.2 | 154.9 |
| Q2 2016 | 129.4 | 140.6 | 156.5 |
| Q1 2016 | 129.0 | 140.3 | 157.3 |
| Q4 2015 | 128.6 | 140.3 | 159.4 |
| Q3 2015 | 129.0 | 140.9 | 159.4 |
| Q2 2015 | 130.6 | 143.2 | 162.0 |
| Q1 2015 | 131.4 | 144.1 | 163.8 |
| Q4 2014 | 131.9 | 146.6 | 165.6 |
| Q3 2014 | 133.1 | 148.6 | 167.0 |
| Q2 2014 | 134.2 | 149.2 | 167.6 |
| Q1 2014 | 136.2 | 149.7 | 169.1 |
| Q4 2013 | 137.6 | 154.8 | 169.3 |
| Q3 2013 | 140.5 | 154.2 | 170.9 |
| Q2 2013 | 140.9 | 155.6 | 167.3 |
| Q1 2013 | 141.2 | 155.3 | 161.1 |
| Q4 2012 | 140.3 | 155.0 | 158.9 |
| Q3 2012 | 139.4 | 153.6 | 153.2 |
| Q2 2012 | 139.2 | 152.3 | 151.6 |
| Q1 2012 | 138.4 | 151.7 | 150.9 |
| Q4 2011 | 139.2 | 152.5 | 149.2 |
| Q3 2011 | 138.5 | 152.4 | 148.4 |
| Q2 2011 | 137.5 | 150.6 | 145.3 |
| Q1 2011 | 135.3 | 148.9 | 142.8 |
| Q4 2010 | 133.9 | 145.9 | 138.6 |
| Q3 2010 | 131.0 | 143.3 | 135.8 |
| Q2 2010 | 128.9 | 140.0 | 132.9 |
| Q1 2010 | 122.4 | 133.8 | 125.7 |
| Q4 2009 | 117.2 | 124.1 | 120.5 |
| Q3 2009 | 109.2 | 113.3 | 113.4 |
| Q2 2009 | 94.8 | 95.6 | 97.7 |
| Q1 2009 | 100.0 | 100.0 | 100.0 |
| Q4 2008 | 119.4 | 120.4 | 107.9 |
| Q3 2008 | 127.6 | 128.3 | 114.6 |
| Q2 2008 | 131.2 | 131.5 | 116.3 |
| Q1 2008 | 131.3 | 130.6 | 115.2 |
| Q4 2007 | 126.5 | 126.4 | 111.0 |
| Q3 2007 | 117.7 | 117.4 | 103.7 |
| Q2 2007 | 108.6 | 108.7 | 96.1 |
| Q1 2007 | 100.7 | 100.6 | 89.7 |
| Q4 2006 | 95.4 | 96.9 | 87.9 |
| Q3 2006 | 90.9 | 94.8 | 86.5 |
| Q2 2006 | 86.3 | 94.4 | 85.8 |
| Q1 2006 | 82.5 | 94.4 | 84.5 |
| Q4 2005 | 81.5 | 94.1 | 84.3 |
| Q3 2005 | 79.7 | 94.1 | 83.6 |
| Q2 2005 | 77.9 | 94.1 | 83.6 |
| Q1 2005 | 77.6 | 93.7 | 83.6 |
| Q4 2004 | 76.9 | 92.9 | 83.4 |
| Q3 2004 | 76.4 | 92.2 | 83.0 |
| Q2 2004 | 76.1 | 91.6 | 82.7 |
| Q1 2004 | 76.0 | 91.5 | 83.0 |
Policy measures marked on this chart (22)
- 2025-07-03 Seller's Stamp Duty holding period back to four years, rates raised by 4 pp
- 2024-08-19 HDB loan LTV cut to 75% and Enhanced CPF Housing Grant raised
- 2023-04-26 ABSD rates raised, April 2023
- 2023-02-14 CPF Housing Grant raised for first-time resale buyers, Budget 2023
- 2023-02-14 Buyer's Stamp Duty raised for higher-value properties, Budget 2023
- 2022-09-29 Property measures, September 2022: higher TDSR and MSR rate floor, HDB loan LTV 80%, 15-month wait-out
- 2021-12-15 Property cooling measures, December 2021: higher ABSD, TDSR 55%, HDB loan LTV 85%
- 2018-07-05 Property cooling measures, July 2018: higher ABSD and lower LTV limits
- 2018-02-19 Budget 2018: Proximity Housing Grant enhanced
- 2018-02-19 Budget 2018: top BSD rate raised to 4% above S$1m
- 2017-03-10 SSD holding period cut to 3 years; TDSR relaxed for equity withdrawal
- 2013-08-27 HDB loan and resale measures, August 2013
- 2013-06-28 MAS introduces the Total Debt Servicing Ratio (TDSR) framework
- 2013-01-11 Property cooling measures, January 2013
- 2012-10-05 Maximum loan tenure of 35 years and tighter LTV limits, October 2012
- 2011-12-07 Additional Buyer's Stamp Duty introduced, December 2011
- 2011-01-13 Property cooling measures, January 2011
- 2010-08-30 HDB measures after National Day Rally 2010: DBSS income ceiling, 5-year MOP for non-subsidised flats
- 2010-08-30 Property cooling measures, August 2010
- 2010-02-19 Seller's Stamp Duty introduced and LTV limit cut to 80%, February 2010
- 2009-09-14 Interest-only loans and Interest Absorption Scheme disallowed, September 2009
- 2005-07-19 Property policy review, July 2005: LTV limit raised to 90%, CPF housing rules eased, foreign ownership rules eased
Source: URA. Data to Q3 2026.
Percent of completed private homes vacant
Source: URA, 2Q 2026 real estate statistics (Q2 2026).
Picking one segment lets you learn it properly. In practice:
- Choose one planning area and one type of home, for example resale 2-bedroom condos near an MRT station.
- Track every transaction in the same projects on URA’s transaction search, and the rents actually signed on its rental search. After a year you will know a good price from a hopeful one.
- Watch new supply. The 2026 land sales programme puts 9,320 private homes on the Confirmed List, more than 50% above the 10-year average. Count what completes near you in the year your unit would be ready.
A small investor gains more from knowing one market well than from owning a thin slice of five.
Strategy 2: Be the low-cost owner
In 2026 the biggest costs are the ones you can see before you buy. Take a hypothetical S$1.5m condo bought as a second home by a Singapore Citizen.
| Cost | Amount |
|---|---|
| Buyer’s Stamp Duty | S$44,600 |
| ABSD at 20% | S$300,000 |
| Downpayment (the bank can lend 45% of the price, so you pay 55%) | S$825,000 |
| Cash and CPF needed | S$1,169,600 |
Then there is the loan. A S$675,000 loan over 30 years costs about S$2,428 a month at 1.8%, which is about where floating packages sit after the Fed’s September hike. At 4%, the rate banks must use to test you, it costs S$3,223.
Three habits keep costs down:
- Treat the 55% debt ceiling as a limit. TDSR decides what a bank will lend. Our guide to TDSR and MSR shows how it works.
- Keep a cash buffer. Six months of instalments at 4% on this loan is about S$19,300, before maintenance fees and property tax. Add those and plan for more.
- Remove debts that produce nothing. A car loan counts against your TDSR in full, so clearing it can lift your borrowing limit by a large amount.
Invest in yourself too. Your salary is what the bank lends against, and it pays the mortgage when the tenant leaves. Your skills are the one asset a market fall cannot reprice.
Strategy 3: Build the cash pile before the portfolio
Many investors argue that cash becomes the most valuable asset in a downturn, when assets sell at “fire-sale prices”. Cash does give you choices. But the maths of a downturn is less generous than it sounds, because stamp duties do not fall as fast as prices.
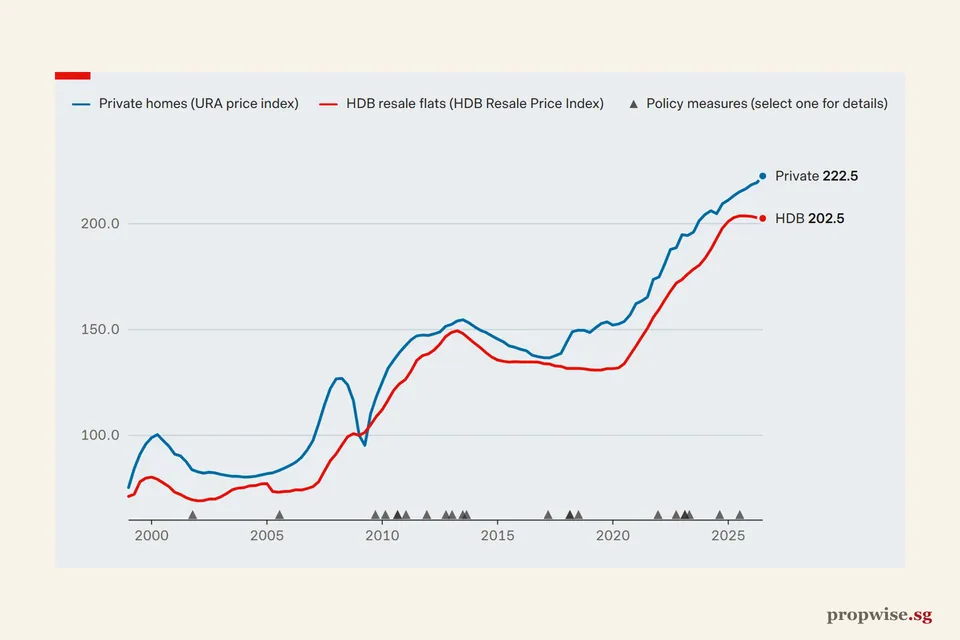
Compare buying the same condo at today’s S$1.5m and after a 12% fall to S$1.32m. A 12% fall is close to the 11.6% drop in URA’s index from Q3 2013 to Q2 2017.
| Second home, Singapore Citizen | Price S$1.5m | Price S$1.32m |
|---|---|---|
| BSD | S$44,600 | S$37,400 |
| ABSD (20%) | S$300,000 | S$264,000 |
| Downpayment (55%) | S$825,000 | S$726,000 |
| Cash and CPF needed | S$1,169,600 | S$1,027,400 |
The 12% fall saves you S$180,000 on the price. The stamp duties you still pay are S$301,400, which is 23% of the new price. So waiting for a fall helps.
Two further points temper the “scoop up bargains” idea. First, the last long downturn was slow: the index fell for about four years, not in a single crash. Anyone waiting for the bottom had to sit in cash for years, and nobody could tell in advance which quarter was the low. Second, cash earns less than a property would in a rising market. CPF Ordinary Account money earns 2.5% with no risk. That is the price of waiting, and you should know it before you wait. Our guide on preparing for a market fall covers more ways to get ready.
- Private homes (URA price index)
- HDB resale flats (HDB Resale Price Index)
- Policy measures (select one for details)
Latest: Private 222.5 (Q3 2026), up 3.4% on Q3 2025; HDB 202.5 (Q3 2026), down 0.6% on Q3 2025.
Table view
| Period | Private homes (URA price index) | HDB resale flats (HDB Resale Price Index) |
|---|---|---|
| Q3 2026 | 222.5 | 202.5 |
| Q2 2026 | 219.4 | 202.8 |
| Q1 2026 | 218.3 | 203.4 |
| Q4 2025 | 216.4 | 203.6 |
| Q3 2025 | 215.1 | 203.7 |
| Q2 2025 | 213.2 | 202.9 |
| Q1 2025 | 211.1 | 201.0 |
| Q4 2024 | 209.4 | 197.9 |
| Q3 2024 | 204.7 | 192.9 |
| Q2 2024 | 206.1 | 187.9 |
| Q1 2024 | 204.3 | 183.7 |
| Q4 2023 | 201.5 | 180.4 |
| Q3 2023 | 196.0 | 178.5 |
| Q2 2023 | 194.4 | 176.2 |
| Q1 2023 | 194.8 | 173.6 |
| Q4 2022 | 188.6 | 171.9 |
| Q3 2022 | 187.8 | 168.1 |
| Q2 2022 | 180.9 | 163.9 |
| Q1 2022 | 174.8 | 159.5 |
| Q4 2021 | 173.6 | 155.7 |
| Q3 2021 | 165.3 | 150.6 |
| Q2 2021 | 163.5 | 146.4 |
| Q1 2021 | 162.2 | 142.2 |
| Q4 2020 | 157.0 | 138.1 |
| Q3 2020 | 153.8 | 133.9 |
| Q2 2020 | 152.6 | 131.9 |
| Q1 2020 | 152.1 | 131.5 |
| Q4 2019 | 153.6 | 131.5 |
| Q3 2019 | 152.8 | 130.9 |
| Q2 2019 | 150.8 | 130.8 |
| Q1 2019 | 148.6 | 131.0 |
| Q4 2018 | 149.6 | 131.4 |
| Q3 2018 | 149.7 | 131.6 |
| Q2 2018 | 149.0 | 131.7 |
| Q1 2018 | 144.1 | 131.6 |
| Q4 2017 | 138.7 | 132.6 |
| Q3 2017 | 137.6 | 132.8 |
| Q2 2017 | 136.6 | 133.7 |
| Q1 2017 | 136.7 | 133.9 |
| Q4 2016 | 137.2 | 134.6 |
| Q3 2016 | 137.9 | 134.7 |
| Q2 2016 | 140.0 | 134.7 |
| Q1 2016 | 140.6 | 134.7 |
| Q4 2015 | 141.6 | 134.8 |
| Q3 2015 | 142.3 | 134.6 |
| Q2 2015 | 144.2 | 135.0 |
| Q1 2015 | 145.5 | 135.6 |
| Q4 2014 | 147.0 | 137.0 |
| Q3 2014 | 148.6 | 139.1 |
| Q2 2014 | 149.7 | 141.5 |
| Q1 2014 | 151.3 | 143.5 |
| Q4 2013 | 153.2 | 145.8 |
| Q3 2013 | 154.6 | 148.1 |
| Q2 2013 | 154.0 | 149.4 |
| Q1 2013 | 152.4 | 148.6 |
| Q4 2012 | 151.5 | 146.7 |
| Q3 2012 | 148.8 | 143.1 |
| Q2 2012 | 147.9 | 140.3 |
| Q1 2012 | 147.2 | 138.5 |
| Q4 2011 | 147.4 | 137.7 |
| Q3 2011 | 147.0 | 135.4 |
| Q2 2011 | 145.1 | 130.4 |
| Q1 2011 | 142.3 | 126.4 |
| Q4 2010 | 139.2 | 124.4 |
| Q3 2010 | 135.5 | 121.3 |
| Q2 2010 | 131.7 | 116.6 |
| Q1 2010 | 125.1 | 112.1 |
| Q4 2009 | 118.4 | 109.0 |
| Q3 2009 | 110.3 | 105.0 |
| Q2 2009 | 95.3 | 101.4 |
| Q1 2009 | 100.0 | 100.0 |
| Q4 2008 | 116.4 | 100.8 |
| Q3 2008 | 123.9 | 99.4 |
| Q2 2008 | 126.9 | 95.4 |
| Q1 2008 | 126.7 | 91.3 |
| Q4 2007 | 122.1 | 88.0 |
| Q3 2007 | 114.4 | 83.2 |
| Q2 2007 | 105.6 | 78.1 |
| Q1 2007 | 97.6 | 75.8 |
| Q4 2006 | 93.1 | 74.9 |
| Q3 2006 | 89.6 | 74.2 |
| Q2 2006 | 87.3 | 74.3 |
| Q1 2006 | 85.8 | 73.6 |
| Q4 2005 | 84.5 | 73.5 |
| Q3 2005 | 83.3 | 73.2 |
| Q2 2005 | 82.3 | 73.5 |
| Q1 2005 | 81.9 | 77.2 |
| Q4 2004 | 81.3 | 77.1 |
| Q3 2004 | 80.7 | 76.3 |
| Q2 2004 | 80.4 | 76.2 |
| Q1 2004 | 80.3 | 75.3 |
| Q4 2003 | 80.6 | 75.1 |
| Q3 2003 | 80.7 | 74.3 |
| Q2 2003 | 81.1 | 72.5 |
| Q1 2003 | 81.6 | 71.0 |
| Q4 2002 | 82.3 | 69.9 |
| Q3 2002 | 82.6 | 69.9 |
| Q2 2002 | 82.2 | 69.2 |
| Q1 2002 | 82.8 | 69.1 |
| Q4 2001 | 83.8 | 69.6 |
| Q3 2001 | 87.6 | 70.6 |
| Q2 2001 | 90.3 | 72.1 |
| Q1 2001 | 91.1 | 73.2 |
| Q4 2000 | 94.9 | 75.8 |
| Q3 2000 | 97.6 | 77.6 |
| Q2 2000 | 100.4 | 79.3 |
| Q1 2000 | 98.9 | 80.3 |
| Q4 1999 | 95.9 | 79.8 |
| Q3 1999 | 91.1 | 78.1 |
| Q2 1999 | 84.3 | 72.2 |
| Q1 1999 | 75.4 | 71.2 |
Policy measures marked on this chart (23)
- 2025-07-03 Seller's Stamp Duty holding period back to four years, rates raised by 4 pp
- 2024-08-19 HDB loan LTV cut to 75% and Enhanced CPF Housing Grant raised
- 2023-04-26 ABSD rates raised, April 2023
- 2023-02-14 CPF Housing Grant raised for first-time resale buyers, Budget 2023
- 2023-02-14 Buyer's Stamp Duty raised for higher-value properties, Budget 2023
- 2022-09-29 Property measures, September 2022: higher TDSR and MSR rate floor, HDB loan LTV 80%, 15-month wait-out
- 2021-12-15 Property cooling measures, December 2021: higher ABSD, TDSR 55%, HDB loan LTV 85%
- 2018-07-05 Property cooling measures, July 2018: higher ABSD and lower LTV limits
- 2018-02-19 Budget 2018: Proximity Housing Grant enhanced
- 2018-02-19 Budget 2018: top BSD rate raised to 4% above S$1m
- 2017-03-10 SSD holding period cut to 3 years; TDSR relaxed for equity withdrawal
- 2013-08-27 HDB loan and resale measures, August 2013
- 2013-06-28 MAS introduces the Total Debt Servicing Ratio (TDSR) framework
- 2013-01-11 Property cooling measures, January 2013
- 2012-10-05 Maximum loan tenure of 35 years and tighter LTV limits, October 2012
- 2011-12-07 Additional Buyer's Stamp Duty introduced, December 2011
- 2011-01-13 Property cooling measures, January 2011
- 2010-08-30 HDB measures after National Day Rally 2010: DBSS income ceiling, 5-year MOP for non-subsidised flats
- 2010-08-30 Property cooling measures, August 2010
- 2010-02-19 Seller's Stamp Duty introduced and LTV limit cut to 80%, February 2010
- 2009-09-14 Interest-only loans and Interest Absorption Scheme disallowed, September 2009
- 2005-07-19 Property policy review, July 2005: LTV limit raised to 90%, CPF housing rules eased, foreign ownership rules eased
- 2001-10-12 Second off-budget package, October 2001: property tax rebate, stamp duty cut, gains tax removed, land sales eased
Source: URA, HDB. Data to Q3 2026.
Strategy 4: Buy for cash flow and time, not for flips
A sound rule is to buy to rent, never to sell, and to aim for at least S$1,000 a month of positive cash flow per unit. The first half is now enforced by law. Homes bought from 4 July 2025 carry Seller’s Stamp Duty of 16%, 12%, 8% and 4% in years one to four. SSD is charged on the selling price, not the gain, so a first-year flip loses money unless the price jumps by about 19% or more, before buying costs and interest.
| When you sell | Seller’s Stamp Duty |
|---|---|
| Within 1 year of purchase | 16% |
| More than 1 year, up to 2 years | 12% |
| More than 2 years, up to 3 years | 8% |
| More than 3 years, up to 4 years | 4% |
The second half is harder. Using the same S$1.5m condo, say it rents out with a net operating income of S$36,000 a year (S$3,000 a month, a 2.4% net yield after property tax, maintenance, fees and vacancy).
| Monthly figure | Rate 1.8% | Rate 4% |
|---|---|---|
| Net operating income | S$3,000 | S$3,000 |
| Loan payment (S$675,000, 30 years) | −S$2,428 | −S$3,223 |
| Cash flow after loan | +S$572 | −S$223 |
To reach +S$1,000 a month at 1.8%, net income would have to be about S$41,100 a year, a 2.7% net yield. At 4% it would be about S$50,700, a 3.4% yield. For comparison, Global Property Guide puts the average Singapore gross yield for the first half of 2026 at about 3.1%, and net yield is lower. Our guide to rental yield shows how to work it out.
Percent a year
Source: Worked example in the article (October 2026); Global Property Guide, Singapore rent yields (first half of 2026). The example condo earns S$36,000 a year net. The 3.1% average is a gross yield, so it is not a like-for-like bar.
It means you test it honestly:
- Hold power is the strategy. A property that is slightly negative at a 4% rate but positive at today’s rate can work if you can fund the gap for years.
- Lower leverage helps. A bigger downpayment cuts the loan payment, and an investor with no other debt can borrow up to 75%, which makes the maths different.
- Total return counts. Rent plus growth, less every cost, is what you actually earn. See how to calculate your property’s return.
Write your rules, then follow them
The last strategy is mindset: follow rules. The way to do that is to write the rules before you start looking. For example:
- I will buy only in one named area and segment.
- I will pay only if the numbers work at a 4% interest rate.
- I will keep six months of all property costs in cash.
- I will hold for at least four years, which is the SSD period.
- I will walk away from any scheme I cannot explain in two sentences.
A rule you wrote before the showflat visit is harder for a sales pitch to move. Our guides to the four fundamental rules and common investment mistakes go deeper on the same discipline. This article is general information, not personal financial advice.
Bottom line
The upside-down idea holds: know one market well, stay lean, keep cash and look at income, not hype. The 2026 rules make each step more expensive and less forgiving. ABSD and SSD punish quick moves. Stress tests punish thin buffers. Run your own numbers in the mortgage calculator before you decide.